


 客服




10 MHz 至 6 GHz 频率范围
使用选件 H3,频率范围可扩展至 3 MHz 至 6 GHz
宽广的动态范围:-60 至 +25 dBm(取决于传感器选件)
具有内部调零功能,无需外部校准
最高 250 个读数/秒的高测量速度
支持内部/外部触发测量、内部触发和迹线显示
可在计算机或其他是德科技仪器上显示功率测量结果
仪器现在内置 BenchVue 软件许可证(BV0007B)。 BenchVue 让连接和控制仪器以及自动执行测试序列变得非常简单
ONETEST 欢迎您
厂商登录 | 入驻
登录 | 注册 购物车 微信公众号厂商登录
类似产品

频率范围1 MHz 至 8 GHz对任何调制信号进行精确功率测量动态范围 -60 dBm 至 +26 dBm包括内部和外部触发Just Measure– 使用前获得专利的 NoZero NoCal 技术多种选项,例如无人值守操作、安全和模拟输出兼容U2000用于 ATE、直接控制和嵌入式应用的 SPI 和 I2C 接口USBTMC、USBHID IVI 基础和 SCPI 命令集通过所有三个接口设置 SCPI 命令大量内存用于跟踪和长期记录实时时钟和备份
同厂商产品
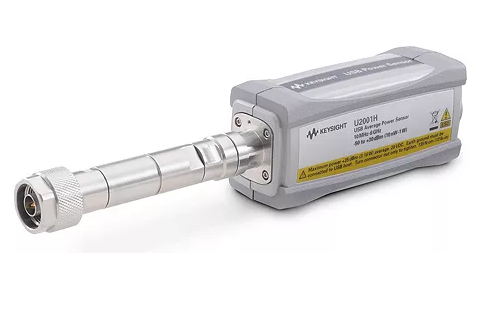
频率范围:10 MHz 至 18 GHz宽广的动态范围(-30 dBm 至 +44 dBm)连接被测器件时内部归零测量速度快,高达 250 个读数/秒支持内部/外部触发测量、内部触发和迹线显示无需功率计,能够在计算机上显示功率测量结果兼容其他是德科技仪器仪器现在内置 BenchVue 软件许可证(BV0007B)。 BenchVue 让连接和控制仪器以及自动执行测试序列变得非常简单
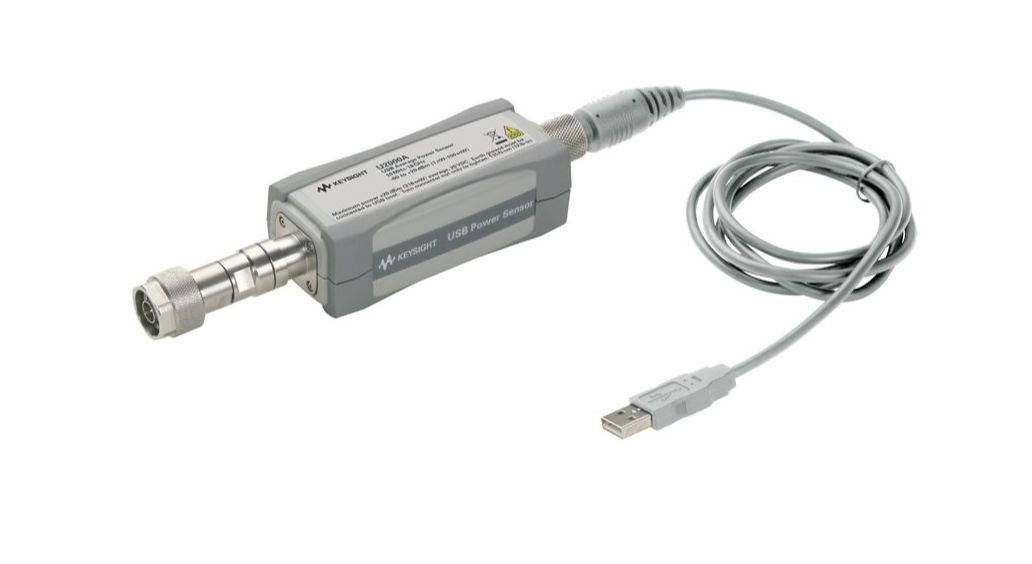
10 MHz 至 18 GHz 频率范围-60 至 +20 dBm 的宽广动态范围具有内部调零功能,无需外部校准最高 250 个读数/秒的高测量速度支持内部/外部触发测量、内部触发和迹线显示可在计算机或其他是德科技仪器上显示功率测量结果仪器现在内置 BenchVue 软件许可证(BV0007B)。 BenchVue 让连接和控制仪器以及自动执行测试序列变得非常简单
频率范围:10 MHz 至 6 GHz宽广的动态范围(-50 dBm 至 +30 dBm)连接被测器件时内部归零测量速度快,高达 250 个读数/秒支持内部/外部触发测量、内部触发和迹线显示无需功率计,能够在计算机上显示功率测量结果兼容其他是德科技仪器仪器现在内置 BenchVue 软件许可证(BV0007B)。 BenchVue 让连接和控制仪器以及自动执行测试序列变得非常简单
- «
- 1
- »

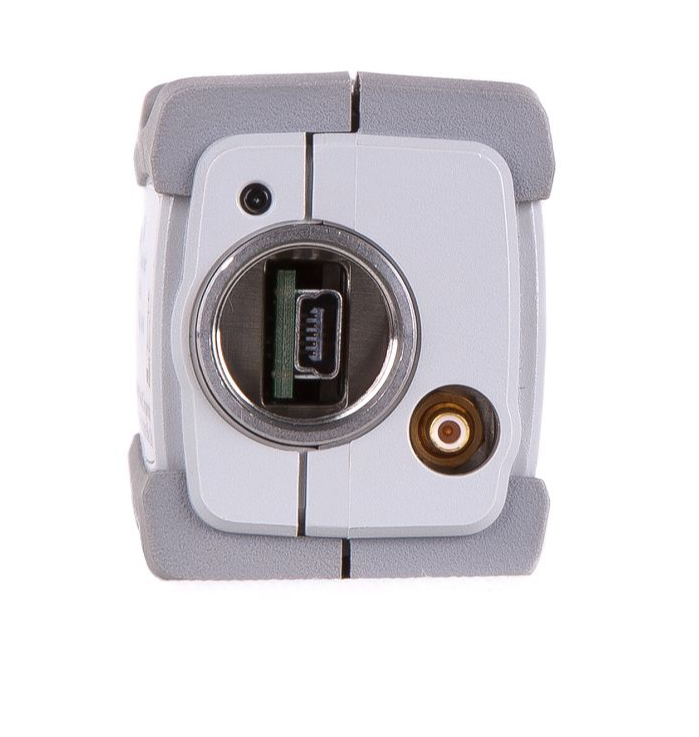

U2000系列U2001B 10MHz至6GHz USB 平均功率传感器 –30dBm至+44dBm|是德/KEYSIGHT (在产)
参考价格 : US$ 8,319
产品描述
详细指标
软件和手册|白皮书
购买渠道
选件
问大家
视频
测评
口碑
系统与解决方案
是德科技|KEYSIGHT
10 MHz 至 6 GHz USB 功率传感器
USB和LAN电源传感器
产品简介
U2001B USB 功率传感器能够测量 10 MHz 至 6 GHz 频率范围和 –30 dBm 至 +44 dBm 功率范围内的平均功率。
核心参数
• 接头类型:N 型
• 频率范围:10 MHz 至 6 GHz
• 功率范围:-30 至 +44 dBm
• 连接方式:USB
功能特性
• 产品亮点
频率范围:10 MHz 至 6 GHz
宽广的动态范围(-30 dBm 至 +44 dBm)
连接被测设备时进行内部归零
测量速度快,高达 250 次读数/秒
支持内部/外部触发测量、内部触发和波形显示
无需功率计,即可在计算机上显示功率测量结果
与其他是德科技仪器兼容
该仪器现已内置BenchVue 软件许可证(BV0007B)。
BenchVue 使连接和控制仪器以及自动执行测试序列变得非常简单
资源下载
以上内容与指标均取自是德科技(KEYSIGHT)官网该产品详情页与官方产品资料,未标注口径的为厂家公布值。
是德科技|KEYSIGHT · onetest 仪器资源库
是德科技 | KEYSIGHT
U2000系列U2001B 10MHz至6GHz USB 平均功率传感器 –30dBm至+44dBm 详细指标
USB和LAN电源传感器
一、Specifications
条件:apply to Continuous Wave (CW) signals unless otherwise stated. The recommended calibration interval
Specifications contained in this chapter are valid ONLY after proper calibration of the power sensor and
for this product is one year
条件:Specifications apply over a temperature range 0 to +55 °C unless otherwise stated. Specifications quoted
standard environmental test conditions. Specifications are valid after a 30-minute warm-up period.
characteristics are shown in italics or denoted as “typical”, “nominal” or “approximate”.
over a temperature range of 25 °C
± 10 °C apply to a relative humidity of 15% to 75% and conform to the
Supplemental characteristics, shown in italics, are intended to provide useful information regarding
applying power sensors in that they contain typical, but non-warranted performance parameters. These
3 November 1986 Hewlett -Packard Journal pages 14-
2, “Diode Integrated Circuits for Millimeter -Wave Applications”.
4 Refer to “Maximum Power” on page
9 for maximum power handling specifications.
测量速度
Normal
20 readings/s
x2
40 readings/s
Fast
110 readings/s
Buffered (50 readings): 1000 readings/s
5
The U2000 Series USB sensors have two measurement modes:
Average only mode (default mode): Optimized for wide dynamic range. In this measurement mode, a
trigger can be controlled externally via TTL input
Normal6 mode: Used for making average power measurement in a defined time interval (time-gated
measurement) with reduced dynamic range. A trigger can be derived from an RF signal (internal trigger)
型号频率范围功率量程最大值功率
条件:measurements that can be obtained in one second is 250 readings in buffered mode.
U2000A 10 MHz to 18 GHz –60 to +20 dBm +25 dBm avg
20 VDC
U2001A 10 MHz to 6 GHz +33 dBm pk, <
10 µs
U2002A
50 MHz to 24 GHz
U2004A 9 kHz to 6 GHz –60 to +20 dBm +25 dBm avg
5 VDC
+33 dBm pk, <
10 µs
U2000B 10 MHz to 18 GHz –30 to +44 dBm +45 dBm avg
20 VDC
U2001B 10 MHz to 6 GHz +47 dBm pk
1 µs
U2000H 10 MHz to 18 GHz –50 to +30 dBm +33 dBm avg
20 VDC
U2001H 10 MHz to 6 GHz +50 dBm pk
1 µs
U2002H 50 MHz to 24 GHz –50 to +30 dBm +33 dBm avg
10 VDC
+50 dBm pk
1 µs
5 The 1000 reading/s is the derived measurement speed from the first
50 readings in buffered mode. The maximum number of
6 Not applicable for U2004A.
最大值 SWR
Model Frequency Range Maximum SWR (25 °C
± 10 °C) Maximum SWR (0 °C to 55 °C)
U2000A 10 to 30 MHz 1.15
1.21
> 30 MHz to < 2 GHz 1.13
1.15
2 to < 14 GHz 1.19
1.20
14 to < 16 GHz 1.22
1.23
16 to 18 GHz 1.26
1.27
U2001A 10 to 30 MHz 1.15
1.21
> 30 MHz to < 2 GHz 1.13
1.15
2 to 6 GHz 1.19
1.20
U2002A 50 MHz to 2 GHz 1.13
1.15
> 2 to 14 GHz 1.19
1.20
> 14 to 16 GHz 1.22
1.23
> 16 to 18 GHz 1.26
1.27
> 18 to 24 GHz 1.30
1.30
U2004A 9 kHz to 2 GHz 1.13
1.15
> 2 to 6 GHz 1.19
1.20
U2000B 10 MHz to 2 GHz 1.12
1.14
> 2 to < 12.4 GHz 1.17
1.18
12.4 to 18 GHz 1.24
1.25
U2001B 10 MHz to 2 GHz 1.12
1.14
> 2 to 6 GHz 1.17
1.18
U2000H 10 MHz to < 8 GHz 1.15
1.17
8 to < 12.4 GHz 1.25
1.26
12.4 to 18 GHz 1.28
1.29
U2001H 10 MHz to 6 GHz 1.15
1.17
U2002H 50 MHz to < 8 GHz 1.15
1.17
8 to < 12.4 GHz 1.25
1.26
12.4 to 18 GHz 1.28
1.29
> 18 to 24 GHz 1.30
1.31
Typical SWR for U2000A sensor (25 °C
± 10 °C)
Typical SWR for U2001A sensor (25 °C
± 10 °C)
Typical SWR for U2002A sensor (25 °C
± 10 °C)
Typical SWR for U2004A sensor (25 °C
± 10 °C)
Typical SWR for U2002H sensor (25 °C
± 10 °C)
Typical SWR for U2000H sensor (25 °C
± 10 °C)
Typical SWR for U2000B sensor (25 °C
± 10 °C)
Typical SWR for U2001H sensor (25 °C
± 10 °C)
Typical SWR for U2001B sensor (25 °C
± 10 °C)
Switching Point
The U2000 Series power sensors have two measurement paths: a low-power path and a high-power
path, as shown in the table below
条件:when the power level is close to the switching point, switching point hysteresis has been added.
Example with U2000 “A” suffix sensors: Switching point for the U2000/1/2/4A sensors is at –7 dBm.
Models AUTO (Default) Range Low Power Path High Power Path Switching Point
U2000/1/2/4A –60 to +20 dBm –60 to –7 dBm –7 to +20 dBm
–7 dBm
U2000/1/2H –50 to +30 dBm –50 to +3 dBm +3 to +30 dBm
+3 dBm
U2000/1B –30 to +44 dBm –30 to +23 dBm +23 to +44 dBm
+23 dBm
Each power sensor automatically selects the proper power level path. To avoid unnecessary switching
Offset at switching point: ≤ ± 0.5% (≤
± 0.02 dB) typical
Switching point hysteresis
± 0.5 dBm typical
Hysteresis causes the low power path to remain selected until approximately
–6.5 dBm as the power level
is increased. Above this power, the high-power path is selected. The high-power path remains selected
until approximately
–7.5 dBm is reached as the signal level decreases. Below this power, the low power
功率精度
条件:Specifications valid with the following conditions:
and noise) are excluded in this specification and specified elsewhere in the data sheet.
Typical power accuracy at 25 °C for U2000/1/2/4A sensors11, 12
Typical power accuracy at 25 °C for U2000/1B sensors11, 12
Typical power accuracy at 25 °C for U2000/1/2H sensors ,
and noise) are excluded in this specification and specified elsewhere in the data sheet.
Uncertainty per International Guide (Application Note 1449- 3), 5988- 9215EN for more information on measurement uncertainty.
Typical power accuracy at 25 °C for U2000/1/2H sensors13, 14
per International Guide (Application Note 1449- 3), 5988- 9215EN for more information on measurement uncertainty.
Average only mode power accuracy7 (with exclusions).
Model Power Range Accuracy 1 (25 °C ± 10 °C) Accuracy
1 (0 °C to 55 °C)
U2000/1/2/4A –60 to +20 dBm ± 3.0%
± 3.5%
U2000/1/2H –50 to +30 dBm ± 4.0%
± 5.0%
U2000/1B –30 to +44 dBm ± 3.5%
± 4.0%
• After zeroing8
• Number of averages =
1024
• After
30 minutes of power-on warm-up
7 This accuracy is essentially a combination of linearity, instrumentation accuracy, and traceability to absolute accuracy at
50 MHz
0 dBm. Note: Mismatch uncertainty, calibration factor uncertainty, and power level dependent terms (zero set, drift
8 It is advisable to perform external zeroing on the U2000 Series power sensor for power measurement level below
–30 dBm.
During the external zeroing process, the RF input signal must be switched off or the device- under- test disconnected from the
U2000 Series power sensor.
Normal Mode power accuracy9
10, (with exclusions).
Model Power Range Accuracy (25 °C
± 10 °C)
U2000/1/2/A –30 to +20 dBm
± 4.0%
U2000/1/2H –20 to +30 dBm
± 5.0%
U2000/1B 0 to +44 dBm
± 4.5%
9 This accuracy is essentially a combination of linearity, instrumentation accuracy, and traceability to absolute accuracy at
50 MHz
0 dBm. Note: Mismatch uncertainty, calibration factor uncertainty, and power level dependent terms (zero set, drift
10 The accuracy for –7 to +1 dBm (U2000/1/2A)
+3 to +11 dBm (U2000/1/2H), and +23 to +31 dBm (U2000/1B) power level will
be dominated by zero set and measurement noise. For overall accuracy, refer to the measurement uncertainty calculator which
is available on the Keysight Technologies Web site. 11 Measurement uncertainty ≤ 1.9%. At room temperature and excluding power level dependent terms (zero set, drift, and noise). Refer to Keysight Fundamentals of RF and Microwave Power Measurements (Part
3) Power Measurement
12 After zeroing
30 minutes of power- on warm -up, and 1024 averages.
13 Measurement uncertainty ≤ 1.9%. At room temperature and excluding power level dependent terms (zero set, drift, and
noise). Refer to Keysight Fundamentals of RF and Microwave Power Measurements (Part
3) Power Measurement Uncertainty
14 After zeroing
30 minutes of power- on warm -up, and 1024 averages
仅平均模式
Power Range15 Zero Set (Internal) Zero Set (External) Zero Drift16 Measurement Noise17
适用型号 U2000/1/2A
–60 to –35 dBm ± 1.5 nW ± 600 pW 200 pW
1 nW
–38 to –15 dBm ± 2 nW ± 1.5 nW 400 pW
1.5 nW
–20 to –6.5 dBm ± 12 nW ± 10 nW 1.5 nW
15 nW
–7.5 to –2 dBm ± 2 µW ± 500 nW 50 nW
650 nW
–4 to +15 dBm ± 4 µW ± 1 µW 500 nW
1 µW
+10 to +20 dBm ± 6 µW ± 5 µW 2 µW
10 µW
适用型号 U2004A
–60 to –35 dBm ± 2.8 nW ± 600 pW 200 pW
1 nW
–38 to –15 dBm ± 3 nW ± 1.5 nW 400 pW
1.5 nW
–20 to –6.5 dBm ± 12 nW ± 10 nW 1.5 nW
15 nW
–7.5 to –2 dBm ± 2 µW ± 500 nW 50 nW
650 nW
–4 to +15 dBm ± 4 µW ± 1 µW 500 nW
1 µW
+10 to +20 dBm ± 6 µW ± 5 µW 2 µW
10 µW
适用型号 U2000/1/2H
–50 to –25 dBm ± 15 nW ± 8 nW 2 nW
10 nW
–28 to –5 dBm ± 20 nW ± 20 nW 4 nW
15 nW
–10 to +3.5 dBm ± 120 nW ± 100 nW 15 nW
150 nW
+2.5 to +8 dBm ± 20 µW ± 20 µW 500 nW
6.5 µW
+6 to +25 dBm ± 40 µW ± 30 µW 5 µW
10 µW
+20 to +30 dBm ± 60 µW ± 60 µW 20 µW
100 µW
适用型号 U2000/1B 传感器
条件:15 Condition: (i) 0 to 55 °C and (ii) 95% relative humidity at 40 °C non- condensing.
–30 to –5 dBm ± 1.8 µW ± 800 nW 200 nW
1 µW
–8 to +15 dBm ± 2 µW ± 2 µW 400 nW
1.5 µW
10 to +23.5 dBm ± 12 µW ± 10 µW 1.5 µW
15 µW
+22.5 to +28 dBm ± 2 mW ± 1 mW 50 nW
650 µW
+26 to +44 dBm ± 4 mW ± 2 mW 500 µW
1 mW
16 Within one hour after zero set, at a constant temperature, after a
24- hour warm -up of the power sensor.
17 The number of averages at 1 for Normal speed, gate length of 2.27 ms, measured over one- minute interval and two
正常模式
Range
18
Zero Set (Internal)
Zero Set (External) Zero Drift
19
Noise
20
Noise per
Sample
21
适用型号 U2000/1/2A
–38 to –15 dBm 47 nW 43 nW 25 nW 28 nW
90 nW
–20 to –6.5 dBm 530 nW 480 nW 230 nW 300 nW
1 µW
–7.5 to –2 dBm 30 µW 27 µW 19 µW 20 µW
55 µW
–4 to +15 dBm 32 µW 30 µW 24 µW 21 µW
85 µW
+10 to +20 dBm 270 µW 200 µW 110 µW 180 µW
550 µW
适用型号 U2000/1/2H
–28 to –5 dBm 730 nW 500 nW 300 nW 310 nW
900 nW
–10 to 3.5 dBm 5.3 µW 4.8 µW 3 µW 5 µW
10 µW
–2.5 to +8 dBm 330 µW 270 µW 190 µW 230 µW
550 µW
+8 to +25 dBm 440 µW 300 µW 300 µW 260 µW
850 µW
+20 to +30 dBm 3.9 µW 2.8 mW 1.1 mW 2.8 mW
5.5 mW
适用型号 U2000/1B
条件:the number of averages. The noise can be calculated with the following equations.
–8 to +15 dBm 47 nW 43 µW 25 µW 28 µW
90 µW
+10 to +23.5 dBm 530 nW 480 µW 230 µW 300 µW
1 mW
+22.5 to +28 dBm 30 µW 27 mW 19 mW 20 mW
55 mW
+26 to +44 dBm 32 µW 34 mW 24 mW 21 mW
85 mW
Effect of time-gating and averaging on normal mode measurement noise:
The Normal Mode measurement noise will depend on the gate length (time-gated period in second) and
If the gate length is < 2.73 µs, use Equation
1:
NNNNNNNNNN = NNNNNNNNNN pp NNpp NN sssspp ssNN ×
1
Otherwise, use Equation
2:
NNNNaaaaNNaa x �
条件:use the value as specified in the measurement noise table. 18 Condition: (i) 0 to 55 °C and (ii) 95% relative humidity at 40 °C non- condensing. 19 Within one hour after zero set, at a constant temperature, after a 24- hour warm -up of the power sensor. 20 The number of averages at 1 for Normal speed, gate length of 2.27 ms, measured over one- minute interval and two standard
GG aaGGNN llNNllaaGGℎ/(0.
68 µaa)�1/4
Note: If the noise value obtained from Equation
1 or 2 is lower than the measurement noise specification
deviations. 21 The Noise Per Sample specification is only applicable for gated power working range stated in the “Normal Mode Key
规格和特性” table
Effects of averaging on noise: Averaging over
1 to 1024 readings is available for reducing noise. The
table below provides the noise measurement for a particular sensor with the number of averages set at
16 (for normal mode) and 32 (for x2 mode). Use the noise multiplier, for the appropriate of averages, to
U2000A power sensor, –60 to –35 dBm, normal mode, number of averages =
4
Measurement noise calculation: 1 nW x 1.7 =
1.7 nW
仅平均模式
Number of Averages 1 2 4 8 16 32 64 128 256 512
1024
Noise Multiplier
Normal mode 2.0 1.8 1.7 1.5 1.0 0.95 0.74 0.55 0.39 0.29
0.21
x2 mode 2.7 2.4 2.0 1.6 1.0 0.91 0.78 0.53 0.34 0.29
0.20
建立时间
条件:Manual filter, 10-dB decreasing power step (not across switching points).
Auto Filter, Default Resolution
10-dB Decreasing Power
Settling time with auto filter, default resolution, and a
10 dB decreasing power step (not across the
switching point) Settling time =
25 ms22
22 When a power step crosses through the sensor’s auto- range switching point, add
25 ms.
Calibration Factor and Reflection Coefficient
Calibration Factor (CF) and Reflection Coefficient (Rho) data is unique to each sensor. The CF corrects
for the frequency response of the sensor. The reflection coefficient (Rho or ρ) relates to the SWR based
on the following formula
条件:relative uncertainty specifications used for both high and low power paths of each sensor.
SSSSSS =
1 + ρρ
1 + ρρ
Maximum relative uncertainties of the CF data are listed in the following table. There is only one set of CF
The uncertainty analysis for the calibration data was done in accordance with the ISO Guide. The
uncertainty data reported on the calibration certificate is the expanded uncertainty with a
95% confidence
level and a coverage factor of 2.
Frequency Relative Uncertainty (%) (25 °C ± 10 °C)
23
适用型号 U2000A 传感器
10 to 30 MHz
1.8
> 30 MHz to < 2 GHz
1.6
2 to < 14 GHz
2.0
14 to < 16 GHz
2.2
16 to 18 GHz
2.2
适用型号 U2001A 传感器
10 to 30 MHz
1.8
> 30 MHz to < 2 GHz
1.6
2 to 6 GHz
2.0
适用型号 U2002A 传感器
50 MHz to 2 GHz
2.0
> 2 to 14 GHz
2.5
> 14 to 16 GHz
2.7
> 16 to 18 GHz
2.7
> 18 to 24 GHz
3.0
适用型号 U2004A 传感器
9 kHz to 2 GHz
2.0
> 2 to 6 GHz
2.0
适用型号 U2000B 传感器
10 MHz to 2 GHz
3.0
> 2 to < 12.4 GHz
3.2
12.4 to 18 GHz
3.2
23 The characterized calibration factor should not deviate between periodic calibrations by more than the specified maximum
uncertainty in table. Compliance is confirmed by the relative deviation being less than or equal to √2 times the
specified maximum uncertainty. √2∗ UUss ss UU with a reference calibration factor of 100%
Frequency Relative Uncertainty (%) (25 °C ± 10 °C)
23
适用型号 U2001B 传感器
10 MHz to 2 GHz
3.0
> 2 to 6 GHz
3.2
适用型号 U2000H 传感器
10 MHz to < 8 GHz
2.0
8 to < 12.4 GHz
2.0
12.4 to 18 GHz
2.2
适用型号 U2001H 传感器
10 MHz to 6 GHz
2.0
适用型号 U2002H 传感器
50 MHz to < 8 GHz
2.5
8 to < 12.4 GHz
2.5
12.4 to 18 GHz
2.7
> 18 to 24 GHz
3.0
内部触发
Resolution
0.1 dB
Level accuracy
± 1 dB
Jitter
± 1 µs
外部 TTL 触发输入
Impedance 50 Ω or 1 kΩ
24
Trigger low <
1.1 V
Trigger high >
1.9 V
Minimum trigger pulse width
35 ns
Minimum trigger repetition period
80 ns
Trigger latency 11 µs
± 2 µs
触发延迟
Range –0.15 to +
0.15 s
Resolution
1 µs
触发 Hold-关
Range
1 µs to 400 ms
Resolution
1 µs
Trigger Hysteresis
条件:24 This is only available for Option U2001A- H16.
Range
0 to +3 dB
Resolution
0.1 dB
二、正常模式主要指标
Parameters
25 Performance
Maximum video bandwidth
40 kHz
Minimum rise time
40 µs
Minimum fall time
40 µs
Range settling time
150 µs
Minimum pulse width
200 µs
Sampling rate
1.47 Msps
Maximum capture length
150 ms
Maximum pulse repetition rate
150 kHz
Dynamic range U2000/1/2A
–30 to +20 dBm
U2000/1/2H
–10 to +30 dBm
U2000/1B
0 to +44 dBm
三、物理规格
Dimensions (L x W x H) in mm with +/-
1 mm
U2000/1/4A 163.75 x 46.00 x
35.90
U2002A 134.37 x 46.00 x
35.90
U2000/1B 308.00 x 115.00 x
84.00
U2000/1H 207.00 x 46.00 x
36.00
U2002H 164.00 x 46.00 x
36.00
Weight in kg U2000/1/4A
0.262
工作环境
条件:Humidity Up to 95% relative humidity at 40 °C (non-condensing)
Temperature
0 to 55 °C
Altitude Up to 4600 m (15,000 ft)
Pollution Degree
2
存储和 Shipment
条件:Humidity Up to 90% relative humidity at 65 °C (non-condensing)
Environment Sensors should be stored in a clean, dry environment
Temperature
–30 to +70 °C
Altitude Up to 4600 m (15,000 ft)
Pollution Degree
2
25 Not applicable for U2004A.
四、物理规格
Current requirement
200 mA max (approximately)
Connector U2000/1/4A, U2000/1H, U2000/1B: N-type (m)
50 Ω
U2002A, U2002H: 3.5 mm (m)
50 Ω
Cable USB
2.0 Type A to 5-pin Mini-B
Programmability SCPI, Keysight VEE, LabVIEW, Microsoft® Visual Basic
Safety and EMC compliance IEC 61010-1:2001/EN
61010-1:2001(2nd edition)
IEC
61326:2002/EN61326:1997+A1:1998+A2:2001+A3:2003
Canada: ICES-001:2004
Australia/New Zealand: AS/NZS CISPR11:2004
Recommendation calibration interval 26
1 year
五、机械规格
Mechanical characteristics such as center conductor protrusion and pin depth are not performance
specifications. They are, however, important supplemental characteristics related to electrical
performance. At no time should the pin depth of the connector be protruding
Recommended torque 值 · 连接器类型
条件:breakaway torque wrench will be bent, preventing damage to the RF connector.
When making connections for measurements, users are advised to use a breakaway torque wrench. Turn
the connector nut only to tighten. The rotating force applied must not exceed recommended torque value
as per table below. A correct breakaway torque wrench used will ensure that the rotating force is not
excessive. However, if any excessive force is applied to a sufficiently tightened connection, the
连接器类型耦合 torque (lb-in)
Type N 50 ohm
12
3.5 mm
8
For more information, refer to: Seven Practices to Prevent Damaging Power Meters and Power Sensors | Keysight
26 See “Ordering information” for available options.
Using the U2000 Series with the BenchVue
条件:intuitive, multiple instrument measurement visibility and data capture with no programming necessary.
The U2000 Series is supported by the Keysight BenchVue software’s BV0007B Power Meter/Sensor
Control and Analysis app. Keysight BenchVue software for the PC accelerates testing by providing
You can derive answers faster than ever by easily viewing, capturing and exporting measurement data
and screen shots. BenchVue Basic Power Meter/Sensor App (BV0007B) is now included with your
Data log view
Trace view (up to 4 channels or traces on one graph)
Compact 模式显示
Graph functions Single marker (up to 5 markers per graph)
Dual marker (up to 2 sets of markers per graph)
Graph zooming
Gate measurement analysis (up to 4-pair of gates)
Pulse characterization functions
17-point automatic pulse parameters characterization
Instrument settings Save and recall instrument state including graph settings
FDO tables
条件:Full instrumentation control includes frequency/average/trigger settings, zero, etc.
Limit and alert function Sensors Limit and alert notification
Export data or screen shots
Data logging (HDF5/MATLAB/Microsoft Excel/Microsoft Word/CSV)
PC 操作系统
Windows 11,10 and 8 Windows 11
64-bit
Windows 10
32-bit and 64-bit (Professional, Enterprise, Education, Home versions)
Windows
32-bit and 64-bit (Core, Professional, Enterprise)
Computer hardware Professor
1 GHz or faster (2 GHz or greater recommended)
RAM
1 GB (32-bit) or 2 GB (64-bit) (3 GB or greater recommended)
Interfaces USB, GPIB, LAN, RS-232
Display resolution 1024 x 768 minimum for single instrument view (higher resolutions are recommended
Additional Requirements
条件:automatically when BenchVue is installed. IO Libraries information is available at:
Software: BenchVue requires a VISA (Keysight or National Instruments) when used to connect to
physical instruments. Keysight IO Libraries, which contains the necessary VISA, will be installed
型号说明功率量程连接器类型
U2000A 10 MHz to 18 GHz USB sensor –60 to +20 dBm N-type male
50 Ω
U2000B 10 MHz to 18 GHz USB sensor –30 to +44 dBm N-type male
50 Ω
U2000H 10 MHz to 18 GHz USB sensor –50 to +30 dBm N-type male
50 Ω
U2001A 10 MHz to 6 GHz USB sensor –60 to +20 dBm N-type male
50 Ω
U2001B 10 MHz to 6 GHz USB sensor –30 to +44 dBm N-type male
50 Ω
U2001H 10 MHz to 6 GHz USB sensor –50 to +30 dBm N-type male
50 Ω
U2002A 50 MHz to 24 GHz USB sensor –60 to +20 dBm 3.5 mm male
50 Ω
U2002H 50 MHz to 24 GHz USB sensor –50 to +30 dBm 3.5 mm male
50 Ω
U2004A 9 kHz to 6 GHz USB sensor –60 to +20 dBm N-type male
50 Ω
选件和附件
U2001A-H03 U2001A sensor with extended frequency range
3 MHz to 6 GHz
U2001A-H16 With 1K ohms input trigger impedance. Higher impedance is typically required when instruments’
input trigger ports are connected in parallel for triggering purposes. Standard option has
50 ohms
输入触发阻抗
U2001A-H25 U2001A sensor with extended power range
–60 to +25 dBm
U2002A-H26 U2002A sensor with extended frequency range
10 MHz to 26.5 GHz
标配-Shipped 附件
Trigger cable BNC Male to SMB female 50 Ω
1.5 m
Power sensor cable: 1.5 m
3.0 m, or 5.0 m
Keysight enables innovators to push the boundaries of engineering by quickly solving
design, emulation, and test challenges to create the best product experiences. Start your
This information is subject to change without notice. © Keysight Technologies, 201 1 - 202
6
Published in USA, January 6, 202 6, 5989
-6278EN
Cables Description
U2031A USB 2.0 Type A to 5-pin Mini-B cable with secure locking mechanism
1.5 m (5 ft)
U2031B USB 2.0 Type A to 5-pin Mini-B cable with secure locking mechanism
3.0 m (10 ft)
U2031C USB 2.0 Type A to 5-pin Mini-B cable with secure locking mechanism
5.0 m (16.4 ft)
U2032A BNC (m) to SMB (f) trigger cable, 1.5 m
50 W
Travel Kits
U2000A-201 Transit case 27 (500mm (L) x 399mm (W) x
138mm (H))
U2000B-201 Transit case 28 (500mm (L) x 400mm (W) x
180mm (H))
Hanging Kit
U2000A-203 Holster (104mm (L) x 50mm (W) x
39mm (H))
Option 1A7 ISO
17025 calibration with test data
Option A6J ANSI Z540 calibration with test data
BV0007B BenchVue Power Meter/Sensor Control and Analysis app license
以上指标摘自厂家官方数据手册,完整定义、测试条件与保证值口径以手册为准。完整指标、测试条件与定义口径请见产品页「软件和手册 | 白皮书」栏目中的官方数据手册。
是德科技 | KEYSIGHT · onetest 仪器资源库
全部
是德科技官方渠道
官方渠道(官网 / 热线 / 邮箱)
• 销售服务热线
800-810-0189(座机)/400-810-0189(手机) 工作时间 周一至周五 8:30-17:30
• 热线传真
800-820-2816(座机)/400-820-3863(手机)
• 亚洲区支持邮箱 tm_asia@keysight.com
• 服务与支持邮箱
instruments_services@keysight.com
• 官网
www.keysight.com(中国站 www.keysight.com.cn)
全国办事处
• 北京总部
是德科技(中国)有限公司 北京市朝阳区望京北路3号
电话:(010) 64397888
传真:(010) 64390278
邮编:100102
• 上海分公司
上海市虹口区四川北路1350号中信泰富申虹广场5楼、16-19楼
电话:(021) 36127688
传真:(021) 36127188
邮编:200080
• 广州分公司
广州市天河北路233号中信广场66层07-08室
电话:(020) 38113988
传真:(020) 86695074
邮编:510613
• 深圳分公司
深圳市福田中心区福华一路六号免税商务大厦3楼
电话:(0755) 83079588
传真:(0755) 82763181
邮编:518048
• 成都分公司
成都高新区南部园区天府四街116号
电话:(028) 83108888
传真:(028) 85330830
邮编:610041
• 西安分公司
西安市碑林区南关正街88号长安国际大厦D座5/F
电话:(029) 88867770
传真:(029) 88861330
邮编:710068
• 中国香港
是德科技香港有限公司 中国香港北角电气道169号25楼
电话:(852) 31977777
传真:(852) 25069292 香港热线 800-938-693
• 维修 / 校准服务中心
中国大陆 北京 / 成都 / 苏州 服务热线 800-810-0189 / 400-810-0189
授权分销商
• 上海信果电子科技有限公司(上海)
上海市沪闵路8075号虹梅商务大厦6楼609室
邮编:200233
电话:021-64518399
传真:021-54560890
邮箱:jason.wu@signalgroup.com.tw
• 上海精测电子有限公司(上海)
上海市北京东路668号西楼15E
邮编:200001
电话:13916371522
传真:021-53086102
邮箱:yangzhen@jingce.com
• 北京东方中科集成科技股份有限公司(北京)
北京市海淀区复兴路69号院12号楼2层、7层 邮政编码:100039
邮编:100039
电话:400-650-5566
传真:010-68728001
邮箱:zhangzp@oimec.com.cn
官网:www.dfzk.com/br_keysight.html
• 北京千聚科技发展有限公司(北京)
北京市海淀区西三旗花园雪梨澳乡A区23-4号
邮编:100085
电话:010-82907162
邮箱:zhuqihui@qianjukeji.com.cn
• 北京金龙翌阳科技发展有限公司(北京)
北京市海淀区大柳树路17号富海大厦2001室
邮编:100086
电话:010-62167379/6213538
邮箱:zhy@yy17.com
官网:www.yy17.com
• 厦门同昌源电子有限公司(厦门)
厦门市湖里区悦华路215号综合楼二楼C单元
邮编:361000
电话:0592-5663715
传真:0592-2236795
邮箱:tcydz@xmtcy.com
• 合肥新普仪测科技有限公司(合肥)
安徽省合肥市长江路53号长江大厦1102室
邮编:230001
电话:+86(0551)65177518 ext:
传真:+86(0551)6260 7155
邮箱:hfsimple@mail.hf.ah.cn
• 品展国际贸易(上海)有限公司(上海)
上海外高桥保税区泰谷路18号1号楼1105A室
邮编:200003
电话:+86(0512) 6808 6023
传真:+86(0512) 6808 6025
邮箱:melody@chtek.com.tw
官网:chtek.com.tw
• 广州康祺科技发展有限公司(广州)
广州市天河区华强路1号珠控国际中心8层06单元
邮编:510623
电话:020-38295200
传真:020-38295122
邮箱:baobao@kontchi.com
• 广州科欣仪器有限公司(广州)
广州市黄埔区黄埔大道933号209室
邮编:510700
电话:86-20-38699788
传真:86-20-34395932
邮箱:cs@gzkexin.com.cn
• 成都安诚迅飞电子科技有限公司(成都)
成都市武侯区人民南路四段27号1栋1单元 24层3号
邮编:610041
电话:028-86027579
邮箱:jincai.he@ancentest.com
• 新亚制程(浙江)股份有限公司(深圳)
深圳市福田区中康路卓越城梅林中心广场(北区)一期1栋3楼
邮编:518035
电话:0755-23818536
传真:0755-23818625
邮箱:wangrongbin@sunyes.cn
• 无锡市邦达测量科技有限公司(无锡)
江苏省无锡市新区长江北路112号
邮编:214028
电话:0510-85258521 ext:
邮箱:bdyiqi@bdyiqi.com
• 武汉力德仪测科技有限公司(武汉)
武汉市光谷大道54号国际企业中心四期A座501室
邮编:430074
电话:027-85481090 ext:
邮箱:liuyang@leader-e.com
• 苏州工业园区贝奇仪器有限公司(苏州)
苏州工业园区通园路398号海逸大厦A402室
邮编:215006
电话:0512-62883832
邮箱:szbeiqi@szbeiqi.net
• 青岛鲁芯仪器有限公司(青岛)
青岛市福州北路135号鼎都1号写字楼328室
邮编:266007
电话:15953279543
传真:0532-80669058-830
邮箱:gaochangyuan@qdluxin.com
• Avnet Electronics Marketing(Phoenix)
2211 South 47th Street
邮编:85034
电话:+65 6289 9164
邮箱:Josephine.Cheong@avnet.com
官网:OnlineSupportAsia@Avnet.com
• RFMW, Ltd.(San Jose)
188 Martinvale Lane
邮编:95119
电话:#09-129
邮箱:sales@rfmw.asia
官网:www.rfmw.com
• 沈阳实拓科技有限公司(沈阳)
沈阳市和平区三好街35号8层
邮编:110004
电话:024-23843636
传真:024-23905232
邮箱:lf@shituokeji.cn
• 領先科儀有限公司(香港)
新界荃灣海盛路3號TML廣場21樓B5室
邮编:.
电话:852-31523600
传真:852-31523608
邮箱:allenma@advanceinst.com
租赁合作伙伴
• 深圳君鉴科技股份有限公司(深圳市)
光明街道观光路华强创意产业园3栋B座12楼光明新区
邮编:518107
电话:400-860-3035
邮箱:shichang@chrent.com
• 益莱储(北京)检测设备租赁有限公司(北京市)
来广营高科技产业园区4号楼3层301朝阳区
邮编:100102
电话:400-819-2800
邮箱:jim.chen@electrorent.com
• 北京东方中科集成科技股份有限公司科技租赁事业部(北京市)
北京市海淀区阜成路67号银都大厦12层
邮编:100142
电话:400-650-5566
传真:010-68728001
邮箱:wangml@oimec.com.cn
• 客而禧设备租赁(上海)有限公司(Shanghai)
徐汇区古美路1515号19号楼903室
邮编:201102
电话:021-54453166
邮箱:krc@krcchina.com
• 深圳市瑞普高电子有限公司(深圳市)
天安云谷产业园一期3栋D座1505-1506龙岗区
邮编:518129
电话:0755-29050100
邮箱:rickluo@ruipugao.com
• 苏州锦凡精密仪器科技有限公司(苏州)
苏州市高新区滨河路625号创业大厦5幢505
邮编:215011
电话:18914031336
邮箱:18914031336@jfsz.net
解决方案合作伙伴
• Tokyo Weld Co., Ltd.(Ota-ku)
2-28-1 Kitamagome
邮编:143-0021
电话:81-3-3775-4331
传真:81-3-3775-4359
邮箱:d-imai@tokyoweld.com
• 上海恒榉电子科技有限公司(Shanghai)
上海市奉贤区南桥镇西闸公路1036号3栋2层
邮编:201401
电话:18112779808
邮箱:salesvalue@everise-hj.com
• 佳燁科技股份有限公司(Ghiatek)(桃園市龜山區)
光明街243巷2號
邮编:33372
电话:+886-3-350-9960
传真:+886-3-320-3475
邮箱:support@ghiatek.com
• 华美博科技(北京)有限公司(北京市)
蓝靛厂东路2号金源时代商务中心C座9A2海淀区
邮编:100097
电话:010-88598732
邮箱:sino@sino-microtech.com
• 和创联合科技(北京)有限公司(北京市)
中关村东路18号财智国际大厦A座1612海淀区
邮编:100083
电话:400 650 7802
邮箱:info@hisuntest.com
• 昆山捷得立电子有限公司(昆山市)
登云路288号海创大厦C座25楼
邮编:215316
电话:0512-36831748
邮箱:sales@jiedeli-china.com
• 深圳市捷泰普科技有限公司(深圳市)
宝安区西乡街道前进二路桃源居南面深圳市智汇创新中心A座216室
邮编:518126
电话:0755-83908488
邮箱:sales@jtptech.cn
• 深圳市易捷测试技术有限公司(深圳市)
福虹路9号世贸广场C座1203室福田区
邮编:518033
电话:0755-83698930
邮箱:dongni.zhang@gbit.net.cn
官网:gbit.net.cn
• 深圳市泰仕捷科技有限公司(深圳市)
松岗大道7号汉海达大厦616室宝安区
邮编:518105
电话:0755-27128586
邮箱:riky.gua@tesijet.com
• 深圳市蓉声科技有限公司(深圳市)
福中路海连大厦连天阁 1103 室福田区
邮编:518033
电话:13828880571
邮箱:jiang.qian@radiation-test.com
• 苏州伊欧陆系统集成有限公司(苏州)
星湖街218号生物纳米园A7楼305室苏州工业园区
邮编:215000
电话:4008808776
邮箱:info@eoulu.com
• EM Labs Inc.(Kobe)
1-4-13 Mizukasadori, Nagata
邮编:653-0842
电话:+81-50-5370-0262
邮箱:info@emlabs.jp
• MPI Corporation(Chupei)
No. 155 Chungho Street
邮编:302
电话:+886-3-555-1771
传真:+886-3-551-8381
邮箱:info@mpi-corporation.com
官网:www.mpi-corporation.com/ast
• NOFFZ(Tönisvorst)
Vorster Strasse 238
邮编:47918
电话:+49 2151-99878-0
邮箱:info@noffz.com
• Power Technology Solutions(Santa Clara)
3048 Scott Blvd
邮编:95054
电话:650-308-8091 ext:
传真:408-727-0827
邮箱:inquiries@pwrts.com
• Resillion(Hasselt)
Kempische Steenweg 303
邮编:3500
电话:+32 498 92 01 71
邮箱:global-ci-sales@resillion.com
• Suzhou Link Ways Tech Co., Ltd.(Suzhou)
16F, Block B, Jin Shi Wang Hu Building, No. 18, Jia Rui alley, SIP
邮编:215021
电话:+86 512 6602 8998
• 上海凌测电子科技有限公司(上海)
峨山路91弄120号陆家嘴软件园8号楼401A室浦东新区
邮编:200127
电话:021-61090608
邮箱:yue.lin@merlintest.com.cn
• 上海北汇信息科技有限公司(上海市)
秀路100号虹桥总部1号4号楼3C闵行区紫
邮编:201103
电话:021-34716271
邮箱:info@polelink.com
官网:polelink.com
• 上海怿星电子科技有限公司(上海市)
钦州北路1199号智汇园87号楼5F室徐汇区
邮编:200233
电话:021-64955659
邮箱:biz@e-planet.cn
• 东昇电磁兼容技术(深圳)有限公司(深圳市)
福田中心区26-3路中国凤凰大厦2栋25G
邮编:518026
电话:0755-82792411
邮箱:sales@jstoyo.cn
• 南京派格测控科技有限公司(南京市)
建邺区建邺人才服务大厦16楼
邮编:210019
电话:4008920858
邮箱:sales@pgtec.cn
官网:pgtec.cn
• 南京纳特通信电子有限公司(南京市)
江宁开发区临淮街20号
邮编:210012
电话:025-84471796
邮箱:sales@rflight.cn
• 深圳市研辰科技有限公司(深圳市)
益田路3008号皇都广场C座2815室福田区
邮编:518048
电话:0755-82828703
邮箱:roger_huang@ascentest.com
原厂翻新与二手仪器
• 是德科技原厂二手仪器商城(Keysight Certified Pre-Owned):www.keysight.com/used/cn/zh/
• 原厂翻新仪器经与新品相同的最终测试与校准,原厂保修最长 5 年;享 40%–90% 折扣,另有线上 5% / 教育 15% 优惠
| U2001B-100 | Type-N (male) connector |
| U2001B-A6J | ANSI Z540-1-1994 Calibration | |
| U2001B-1A7 | Calibration + Uncertainties + Guardbanding (Not Accredited) |
| U2032A | Trigger cable BNC male to SMB female 50ohm, 1.5meter length | |
| U2031C | Power Sensor cable; 16.4-ft (5m) | |
| U2031B | Power Sensor cable; 10-ft (3m) | |
| U2031A | Power Sensor cable; 5-ft (1.5m) |
| U2000A-204 | USB/LAN power sensors soft carrying pouch (210 mm Long x 150 mm Width x 70 mm Height) | |
| U2000A-203 | Power sensor holster (104 mm Long x 50 mm Width x 39 mm Height) | |
| U2000A-202 | Power meter and power sensor soft carrying case (backpack) (405 mm Long x 270 mm Width x 175 mm Height) | |
| U2000B-201 | Transit case |
| U2000A-303 | Power sensor cable; 16.4-ft (5m) | |
| U2000A-302 | Power sensor cable; 10-ft (3m) | |
| U2000A-301 | Power sensor cable; 5-ft (1.5m) |
0条提问
X
提问
X
回答
暂无视频
0条口碑
X
发表口碑




 粤公网安备44030902003758