是德科技 | KEYSIGHT
FieldFox系列N9960D 32GHz 频谱分析仪 120MHz 详细指标
Carry Precision Into The Field
条件:Accuracy, when locked to GPS ±0.010 ppm (nominal)
Accuracy, when GPS antenna is disconnected ±0.4 ppm (nominal) 1
N991xD N9916D
30 kHz to 14 GHz
N995xD N9950D
300 kHz to 32 GHz
Frequency reference (-10 to 55 °C)
Accuracy
±0.9 ppm (spec) + aging
±0.5 ppm (typical) + aging
Aging rate ±1 ppm/yr for 20 years (spec), will not exceed
±3.5 ppm
1 The maximum drift expected in the frequency reference applicable when the ambient temperature changes
±5 °C from the
temperature when the GPS signal was last connected
条件:System impedance 50 Ω (nominal), 75 Ω with appropriate adapter and calibration kit
Frequency resolution Specification (Hz) 30 kHz to 1.91211 GHz
0.67 N991xD, or N995xD (starting from 300 kHz)
≥ 1.91211 to 3.82461 GHz
1.34 N991xD, or N995xD
≥ 3.82461 to 7.64961 GHz
2.68 N991xD, or N995xD
≥ 7.64961 to 15.29961 GHz
5.36 N991xD, or N995xD
≥ 15.29961 to 26.5 GHz
10.73 N991xD, or N995xD
≥ 26.5 to 45.8 GHz
16.09 N995xD
≥ 45.8 to 54 GHz
32.19 N995xD
Data points or resolution 101, 201, 401, 601, 801, 1001, 1601, 4001
10,001
Arbitrary number of points settable through front panel and SCPI
3 Hz, 10 Hz, 30 Hz, 100 Hz, 300 Hz, 1 kHz, 3 kHz, 10 kHz, 30 kHz
100 kHz
High power in the N991xD and N995xD refers to the analyzer’s target output power level when the Power
• N991xD: For a 5 to 10 GHz frequency sweep, the analyzer achieves a
7 dBm power level across the
• N995xD: For an 18 to 26.5 GHz frequency sweep, the analyzer achieves a
4 dBm power level across
Low power level for N991xD and N995xD analyzers flattens at -50 dBm across the entire frequency band
Max leveled power in the N991xD and N995xD refers to the maximum leveled (flattened) power achieved
across the designated frequency range. Examples
条件:parameters, needing both ports 1 and 2, the maximum power the analyzer can be set to is 5 dBm.
parameters, needing both ports 1 and 2, the maximum power the analyzer can be set to is 4 dBm.
• N991xD: For a
1 to 10 GHz frequency sweep with the analyzer configured to measure all four S-
• N995xD: For an
18 to 26.5 GHz frequency sweep with the analyzer configured to measure all four S-
1 VNA mode only. Recommend using averaging in CAT mode.
测试端口输出功率 (dBm), 高功率典型值典型值
> 500 kHz to 10 MHz 0
0
条件:Max leveled output power (dBm) Nominal Nominal
30 kHz to 26.5 GHz -50 dBm (flattened)
±0.5 dB
300 kHz to 54 GHz -50 dBm (flattened)
±0.3 dB
> 300 kHz to 1 MHz -2
-2
CAT High, low, and manual. Default (preset) power is manual
−15 dBm.
条件:available across the whole frequency span, nominal.
Power settable in 1 dB steps across power range. Flat power, in 1 dB steps, is
Power level accuracy
1 Typical
N991xD Port 1 or Port
2 at -15 dBm
> 10 MHz to 26.5 GHz
±0.5 dB
N995xD Port 1 or Port
2 at -15 dBm
> 300 kHz to 54 GHz
±0.5 dB
N991xD Port 1 or Port
−50 dBm ≤ P < max leveled power
> 10 MHz to 26.5 GHz
±0.5 dB
N995xD Port 1 or Port
−60 dBm ≤ P < max leveled power
> 300 kHz to 54 GHz
±0.5 dB
1 P ower levels are calibrated based on PNA- X tuned receiver for the entire frequency range.
条件:30 kHz to 1 MHz ― 114 (nominal) ― 113 (nominal)
300 kHz to 1 MHz ― 105 (nominal) ― 105 (nominal)
Measurement stability over temperature Nominal
System dynamic range 1, 2 (dB), high power, 300 Hz IFBW, 100-point average, Port 1 or Port
2 (-10 to 55 °C)
N991xD S12 spec S12 typical S21 spec S21 typical
> 1 to 5 MHz3 104 111 100
110
> 5 to 6.34 MHz 105 114 100
110
> 6.34 MHz to 10 GHz 103 112 106
115
> 10 to 16 GHz 104 112 107
115
> 16 to 18 GHz 107 117 102
110
> 18 to 24 GHz 102 110 101
111
> 24 to 26.5 GHz 99 108 99
111
N995xD S12 spec S12 typical S21 spec S21 typical
> 1 to 10 MHz3 101 107 99
106
> 10 MHz to 6 GHz 107 115 106
114
> 6 to 16 GHz 105 112 105
113
> 16 to 18 GHz 108 115 105
113
> 18 to 24 GHz 105 112 101
109
> 24 to 26.5 GHz 101 109 98
107
> 26.5 to 32 GHz 96 104 98
105
> 32 to 39 GHz 93 100 93
101
> 39 to 46 GHz 85 93 83
92
> 46 to 50 GHz 82 90 85
92
> 50 to 54 GHz 76 85 75
84
Frequency Magnitude (dB/ºC) Phase (deg/ºC)
条件:3 Exception for S12 Spec and Typical at 5 MHz where the nominal is 90 dB.
N991xD ≤ 6 GHz ±0.010
±0.25
> 6 to 15 GHz ±0.025
±0.35
> 15 to 26.5 GHz ±0.035
±0.4
N995xD 300 kHz to 2 MHz ±0.012
±0.8
> 2 MHz to 6 GHz ±0.008
±0.12
> 6 to 15 GHz ±0.013
±0.32
> 15 to 26.5 GHz ±0.021
±0.48
> 26.5 to 40 GHz ±0.029
±0.8
> 40 to 50 GHz ±0.067
±1.4
> 50 to 54 GHz ±0.088
±1.5
1 System dynamic range is measured in the factory with loads on the test ports after a thru normalization.
2 For CAT mode, “Insertion loss (2- port)”, decrease listed dynamic range specifications by
20 dB, as CAT mode IFBW is fixed at
10 kHz. Can obtain full dynamic range by using S21 measurement in VNA mode with 100 Hz IFBW.
CAT N991xD N995xD
Return loss, 30 kHz to 26.5 GHz, 1-port cal, 1001 points
445 μs/pt ─
Return loss, 300 kHz to 54 GHz, 1-port cal, 1001 points ─
450 μs/pt
Distance-to-fault, 100-meter cable, 1-port cal, 1001 points 470 μs /pt
470 μs/pt
VNA N991xD N995xD
S11 and S21, 30 kHz to 26.5 GHz, enhanced response cal
100 kHz IF
205 μs/pt ─
S11 and S21, 300 kHz to 54 GHz, enhanced response cal
100 kHz IF
─ 210 μs/pt
Trace noise 1, high power, 300 Hz IFBW, Port 1 or Port
2 Specifications (-10 to 55 ⁰C)
Frequency Magnitude (dB rms) Phase (deg rms)
条件:N991xD 30 kHz to 1 MHz 0.0008 (nominal) 0.008 (nominal)
> 50 to 54 GHz 0.05 (nominal) 0.75 (nominal)
> 1 MHz to 5 GHz 0.0014
0.005
> 5 to 15 GHz 0.0016
0.016
> 15 to 26.5 GHz 0.0026
0.035
N995xD 300 kHz to 5 GHz 0.0010
0.010
> 5 to 15 GHz 0.0014
0.014
> 15 to 26.5 GHz 0.0020
0.027
> 26.5 to 32 GHz 0.0030
0.050
> 32 to 44 GHz 0.0040
0.057
> 44 to 50 GHz 0.0040
0.120
Frequency Port 1 or Port
2
N991xD 250 kHz to 2 GHz +7 dBm
0.25 dB compression
> 2 to 5 GHz +8 dBm
0.15 dB compression
> 5 to 26.5 GHz +8 dBm
0.20 dB compression
N995xD 300 kHz to 7 MHz +5 dBm
0.20 dB compression
> 7 MHz to 26.5 GHz +5 dBm
0.10 dB compression
> 26.5 to 54 GHz +5 dBm
0.15 dB compression
Maximum input level Port 1 or Port
2
条件:Immunity to interfering signals (nominal) N991xD, N995xD
N991xD +27 dBm, 0.5 watts
±50 VDC
N995xD +25 dBm, 0.3 watts
±40 VDC
On carrier frequency
+9 dBm
Offset from carrier frequency > 1 MHz
+9 dBm
1 For CAT mode, increase trace noise by a factor of 5.7, as CAT mode IFBW is fixed at 10 kHz. Can use averaging in CAT mode
to reduce trace noise or use VNA mode with 300 Hz IFBW.
Cable loss (1-port)
Insertion loss (2-port) (requires option
211)
TDR (Lin rho) (requires option
215)
TDR (ohm) (requires option
215)
TDR & DTF (requires option
215)
Frequency/distance Start distance, stop distance
Sweep time Units: meters or feet (Can also be set as Preferences)
CAT 模式平均 Set 扫描时间 · seconds
条件:x 2;number of points auto coupled according to start and stop distance entered.
Distance-to-Fault Available in CAT mode. Standard on N991xD analyzers.
Range = velocity factor x speed of light x (number of points
-1) / frequency span
Resolution = range / (number of points
-1)
Dispersion compensation for waveguide: Yes
Return loss, log magnitude
-500 to 500 dB
Log magnitude resolution
0.01 dB
VNA Transmission/Reflection (T/R)
S11, S21 magnitude and phase (requires Option
210)
VNA S-parameters S11, S21, S22, S12 magnitude and phase (requires Options
210 and 211)
Number of traces Four traces available: Tr1, Tr2, Tr3, Tr4
Quad-trace overlay (all four traces on one graticule)
VNA trace formats Log magnitude, linear magnitude, VSWR, phase, Smith chart, polar, group
delay, unwrapped phase, real impedance, imaginary impedance, Z magnitude
扫描触发斜率 Positive, negative
Sweep trigger delay
0 to 10 seconds
Averaging Sweep: 2 to 1000; Point
2 to 500
Smoothing Computes the moving average of adjacent data points. Smoothing aperture
defines the trace width (number of points) to be averaged
Minimum aperture
0.05% of frequency span
Maximum aperture
25% of frequency span
Scale Autoscale, scale, reference level, reference position
Autoscale: Automatically selects scale resolution and reference value to center
Autoscale all: Scales all visible traces
S11, log magnitude
-500 to 500 dB
Log magnitude resolution
0.01 dB
Phase
-180 to +180 degrees (unwrapped phase can show larger values)
Phase resolution
0.01 degrees
Phase offset
-360 to +360 degrees
Magnitude offset
-100 to +100 dB
Trace math Vector division or subtraction of current linear measurement values and
Port extension For both port 1 and port
2, delay settings. Port extensions apply to all
Marker functions Peak, Next Peak, Peak Left, Peak Right, Mkr→Center, Mkr→Delay, Min
Search, Peak Excursion, Peak Threshold, Target, Bandwidth (BW, Q, Loss),
Tracking CAT mode only: Tracking
3 peaks (CAT mode), Mkr→Start distance
Marker types Normal, delta, data trace and memory trace markers
标记耦合 On/关 (耦合 between 迹线)
Frequency blanking Security level: none, high. If high, all frequency information is blanked out. An
instrument preset is required to re-enable the frequency information.
Display data Display data, memory, data and memory, or data math
CAT and VNA mode calibrations
FieldFox analyzers offer three tiers of calibrations, thus providing users with different levels of calibration
CalReady is the most basic calibration and is sufficient for a quick pass/fail or go/no go verification. Every
FieldFox is calibrated at the factory, at test ports
1 and 2, at room temperature. CalReady can be applied
either as an “enhanced response CalReady” or a “2-port CalReady.” The default setting is
2-port
CalReady, so correction is applied to both ports. A user preference allows user to change the CalReady
methodology to enhanced response CalReady
A 30-minute warm-up period is recommended for a quick test. A
60-minute warm-up is necessary for
If CalReady is the basis for most measurements, the annual cal cycle must be followed, as the CalReady
Standard calibrations are the most accurate calibrations offered in FieldFox. FieldFox’s calibration engine
is based on Keysight’s flagship PNA calibration engine, and as such, offers many of the standard
calibrations. FieldFox supports both coaxial and waveguide calibrations. The table below lists the
commonly used calibrations
Keysight recommends a 30-minute warm-up period for standard calibrations. For ultimate in stability and
accuracy, a
90-minute warm-up period is necessary.
条件:errors. 1-port OSL (Port 1) Open, short, and load 1-port OSL (Port 2) Traditional 1-port calibration for reflection measurements. Corrects for directivity, source match, and frequency response errors.
SSL (for waveguide) For waveguide calibrations, depending on the calibration kit definition, this is
Simultaneous magnitude and phase correction of frequency response errors for
either reflection or transmission measurements. Isolation corrects for crosstalk
Reverse enhanced response
Corrects for frequency response and source match. Partial correction for load
match for low-loss reciprocal devices
QSOLT (2-port) QSOLT or Quick short-open-load-thru is FieldFox’s default recommended
calibration for insertable devices. Full
12-term error correction. Requires fewer
connections, compared to traditional SOLT (4 compared to 7). Corrects for
directivity, source match, reflection frequency response, load match, and
FieldFox’s default recommended calibration for non-insertable devices. Full
12-
term error correction. Beneficial for characterizing non-insertable devices such
as Type-N to 3.5 mm, or female-female devices. Corrects for directivity, source
match, reflection frequency response, load match, and transmission frequency
TRL TRL or thru-reflect-line compensates for directivity, reflection, and transmission
frequency response in both the forward and reverse directions.
Note: FieldFox does not offer the traditional SOLT calibration. Instead, it offers the more accurate Full
2- port (unknown thru), and
FieldFox’s guided calibration wizard
条件:kit. FieldFox’s calibration wizard ensures a valid calibration selection.
FieldFox’s calibration wizard recommends a calibration type and calibration kit based on selected
parameters and connector types. Alternatively, users can select their own calibration type and calibration
Interpolation error correction
With any type of accuracy enhancement applied, interpolated mode recalculates the error coefficients
when the test frequencies are changed. The number of points can be increased or decreased, and the
start/stop frequencies can be changed, but the resulting frequency span must be a subset of the original
The FieldFox firmware supports the following connector types by default. Add other connector types with
Coaxial Waveguide Waveguide
Type-N
75 ohm WR-15 WR-112
7/16 WR-22 WR-137
TNC WR-28 WR-187
Type-F WR-42 WR-284
7 mm WR-62 WR-650
3.5 mm WR-75
2.92 mm
2.4 mm
1.85 mm
FieldFox S-parameter measurement uncertainties
The configurations listed below include measurement uncertainties based on ISO GUM methodology
FieldFox model Calibration kit Calibration type DUT connector Uncertainty
N991xD 85518A or 85519A Full
2-port calibration Type-N Spec
N991xD 85054D Full
2-port calibration Type-N Spec
N991xD 85520A or 85521A Full 2-port calibration
3.5 mm Spec
N991xD 85052D Full 2-port calibration
3.5 mm Spec
N991xD N7554A Full
2-port calibration Type-N Spec
N991xD N7555A Full 2-port calibration
3.5 mm Spec
N991xD N4690D Full
2-port calibration Type-N Spec
N991xD N4691D Full 2-port calibration
3.5 mm Spec
N995xD Full
2-port calibration Spec
N995xD Full
2-port calibration Spec
N995xD Full
2-port calibration Spec
N995xD Full
2-port calibration Spec
N995xD Full
2-port calibration Spec
N995xD Full
2-port calibration Spec
N995xD Full
2-port calibration Spec
N995xD Full
2-port calibration Spec
条件:Corrected performance table calculated using uncertainties with a coverage factor of 2.
minute warm-up time. Includes uncertainties due to drift, noise, compression, and dynamic accuracy.
N9916/7/8D, 85518A or 85519A, full
2-port Cal, DUT: Type-N, spec
Corrected performance (dB) 0.3 to 500 MHz 0.5 to 6 GHz 6 to 9 GHz
9 to 18 GHz
Reflection tracking ±0.0004 ±0.023 ±0.024
±0.008
Transmission tracking1 ±0.028 ±0.083 ±0.101
±0.145
Uncertainty plots: power level of -15 dBm
10 Hz IF bandwidth, no averaging, battery saver off, and 60-
Coverage factor of 1 applied to uncertainties, for ease of comparison with other industry handheld
条件:Corrected performance table calculated using uncertainties with a coverage factor of 2.
minute warm-up time. Includes uncertainties due to drift, noise, compression, and dynamic accuracy.
Transmission uncertainty (S21, S12)
Reflection uncertainty (S11, S22)
1 Load match and transmission tracking are typical values
N9916/7/8D, 85054D, full
2-port Cal, DUT: Type-N, spec
Corrected performance (dB) 0.3 to 500 MHz 0.5 to 2 GHz 2 to 8 GHz
8 to 18 GHz
Reflection tracking ±0.00005 ±0.00008 ±0.003
±0.019
Transmission tracking1 ±0.01 ±0.012 ±0.034
±0.064
Uncertainty plots: power level of -15 dBm
10 Hz IF bandwidth, no averaging, battery saver off, and 60-
Coverage factor of 1 applied to uncertainties, for ease of comparison with other industry handheld
条件:Corrected performance table calculated using uncertainties with a coverage factor of 2.
minute warm-up time. Includes uncertainties due to drift, noise, compression, and dynamic accuracy.
Transmission uncertainty (S21, S12)
Reflection uncertainty (S11, S22)
1 Load match and transmission tracking are typical values
N9916/7/8D, 85520A or 85521A, full 2-port Cal, DUT
3.5 mm, spec
Corrected performance (dB) 0.3 to 500 MHz 0.5 to 5 GHz 5 to 15 GHz
15 to 26.5 GHz
Reflection tracking ±0.003 ±0.036 ±0.01
±0.003
Transmission tracking1 ±0.03 ±0.089 ±0.121
±0.156
Uncertainty plots: power level of -15 dBm
10 Hz IF bandwidth, no averaging, battery saver off, and 60-
Coverage factor of 1 applied to uncertainties, for ease of comparison with other industry handheld
条件:Corrected performance table calculated using uncertainties with a coverage factor of 2.
minute warm-up time. Includes uncertainties due to drift, noise, compression, and dynamic accuracy.
Transmission uncertainty (S21, S12)
Reflection uncertainty (S11, S22)
22222222222
1 Load match and transmission tracking are typical values
N9916/7/8D, 85052D, full 2-port Cal, DUT
3.5 mm, spec
Corrected performance (dB) 0.3 MHz to 3 GHz 3 to 8 GHz 8 to 20 GHz
20 to 26.5 GHz
Reflection tracking ±0.001 ±0.003 ±0.016
±0.012
Transmission tracking1 ±0.031 ±0.053 ±0.078
±0.078
Uncertainty plots: power level of -15 dBm
10 Hz IF bandwidth, no averaging, battery saver off, and 60-
Coverage factor of 1 applied to uncertainties, for ease of comparison with other industry handheld
条件:Corrected performance table calculated using uncertainties with a coverage factor of 2.
minute warm-up time. Includes uncertainties due to drift, noise, compression, and dynamic accuracy.
Transmission uncertainty (S21, S12)
Reflection uncertainty (S11, S22)
1 Load match and transmission tracking are typical values
N9916/7/8D, N7554A, full
2-port Cal, DUT: Type-N, spec
Corrected performance (dB) 0.3 to 500 MHz 0.5 to 4 GHz 4 to 9 GHz
9 to 18 GHz
Reflection tracking ±0.003 ±0.002 ±0.015
±0.189
Transmission tracking1 ±0.05 ±0.099 ±0.13
±0.265
Uncertainty plots: power level of -15 dBm
10 Hz IF bandwidth, no averaging, battery saver off, and 60-
Coverage factor of 1 applied to uncertainties, for ease of comparison with other industry handheld
条件:Corrected performance table calculated using uncertainties with a coverage factor of 2.
minute warm-up time. Includes uncertainties due to drift, noise, compression, and dynamic accuracy.
Transmission uncertainty (S21, S12)
Reflection uncertainty (S11, S22)
1 Load match and transmission tracking are typical values
N9916/7/8D, N7555A, full 2-port Cal, DUT
3.5 mm, spec
Corrected performance (dB)1 0.3 to 500 MHz 0.5 to 4 GHz 4 to 9 GHz 9 to 18 GHz
18 to 26.5 GHz
Directivity 44 43 41 35
26
Source match 35 30 25 18
11
Load match2 36 31 25 19
11
Reflection tracking ±0.004 ±0.011 ±0.005 ±0.079
±1.051
Transmission tracking2 ±0.048 ±0.093 ±0.114 ±0.193
±0.453
Uncertainty plots: power level of -15 dBm
10 Hz IF bandwidth, no averaging, battery saver off, and 60-
Coverage factor of 1 applied to uncertainties, for ease of comparison with other industry handheld
条件:Corrected performance table calculated using uncertainties with a coverage factor of 2.
minute warm-up time. Includes uncertainties due to drift, noise, compression, and dynamic accuracy.
Transmission uncertainty (S21, S12)
Reflection uncertainty (S11, S22)
1 When applied power exceeds
-10 dBm, calibration results will be degraded from the performance indicated in this table.
2 Load match and transmission tracking are typical values.
N9916/7/8D, N4690D, full
2-port Cal, DUT: Type-N, spec
Corrected performance (dB)1
0.3 to 10 MHz2
0.3 to
2 MHz3
2 to
10 MHz3
10 to
500 MHz
0.5 to
2 GHz
2 to
10 GHz
10 to
18 GHz
Directivity 45 30 40 45 45 40
38
Source match 36 25 32 36 39 37
32
Load match4 36 25 32 36 39 37
32
Reflection tracking ±0.009 ±0.011 ±0.012 ±0.009 ±0.003 ±0.002
±0.006
Transmission tracking4 ±0.053 ±0.186 ±0.087 ±0.053 ±0.036 ±0.049
±0.067
Uncertainty plots: power level of -15 dBm
10 Hz IF bandwidth, no averaging, battery saver off, and 60-
Coverage factor of 1 applied to uncertainties, for ease of comparison with other industry handheld
条件:Corrected performance table calculated using uncertainties with a coverage factor of 2.
minute warm-up time. Includes uncertainties due to drift, noise, compression, and dynamic accuracy.
Transmission uncertainty (S21, S12)
Reflection uncertainty (S11, S22)
1 When applied power exceeds
-10 dBm, calibration results will be degraded from the performance indicated in this table.
2 For N4690D ECal Option
0DC
3 For N4690D ECal Option
003
4 Load match and transmission tracking are typical values
N9916/7/8D, N4691D, full 2-port Cal, DUT
3.5 mm, spec
Corrected performance (dB)1
0.3 to 10 MHz2
0.3 to
2 MHz3
2 to
10 MHz3
10 to
500 MHz
0.5 to
2 GHz
2 to
10 GHz
10 to
20 GHz
20 to
26.5 GHz
Directivity 46 31 41 46 47 46 43
41
Source match 37 26 33 37 43 40 38
36
Load match4 37 26 33 37 43 40 37
36
Reflection tracking ±0.008 ±0.01 ±0.011 ±0.008 ±0.001 ±0.002 ±0.003
±0.004
Transmission tracking4 ±0.049 ±0.167 ±0.076 ±0.049 ±0.024 ±0.03 ±0.036
±0.037
Uncertainty plots: power level of -15 dBm
10 Hz IF bandwidth, no averaging, battery saver off, and 60-
Coverage factor of 1 applied to uncertainties, for ease of comparison with other industry handheld
条件:Corrected performance table calculated using uncertainties with a coverage factor of 2.
minute warm-up time. Includes uncertainties due to drift, noise, compression, and dynamic accuracy.
Transmission uncertainty (S21, S12)
Reflection uncertainty (S11, S22)
1 When applied power exceeds
-10 dBm, calibration results will be degraded from the performance indicated in this table.
2 For N4690D ECal Option
0DC
3 For N4690D ECal Option
003
4 Load match and transmission tracking are typical values
N9950/1/2D, 85056D, 85563A, or 85564A, full 2-port Cal, DUT
2.4mm, spec
Corrected performance (dB) 1 0.3 to 7 MHz 7 MHz to 4 GHz 4 to 20 GHz 20 to 26.5 GHz
26.5 to 50 GHz
Directivity 39 39 31 27
23
Source match 39 38 30 27
23
Load match 1 38 38 30 26
22
Reflection tracking ±0.00001 ±0.0003 ±0.001 ±0.012
±0.022
Transmission tracking 1 ±0.042 ±0.027 ±0.061 ±0.061
±0.108
Uncertainty plots: power level of -15 dBm
10 Hz IF bandwidth, no averaging, battery saver off, and 60-
Coverage factor of 1 applied to uncertainties, for ease of comparison with other industry handheld
条件:Corrected performance table calculated using uncertainties with a coverage factor of 2.
minute warm-up time. Includes uncertainties due to drift, noise, compression, and dynamic accuracy.
Transmission uncertainty (S21, S12)
Reflection uncertainty (S11, S22)
1 Load match and transmission tracking are typical values
N9950/1/2D, 85561A, full 2-port Cal, DUT
2.92 mm, spec
Corrected performance (dB) 0.3 to 7 MHz 7 MHz to 4 GHz 4 to 20 GHz 20 to 26.5 GHz
26.5 to 40 GHz
Directivity 39 36 27 25
21
Source match 37 31 25 24
20
Load match 1 37 32 25 23
20
Reflection tracking ±0.002 ±0.004 ±0.006 ±0.019
±0.088
Transmission tracking 1 ±0.049 ±0.083 ±0.131 ±0.146
±0.148
Uncertainty plots: power level of -15 dBm
10 Hz IF bandwidth, no averaging, battery saver off, and 60-
Coverage factor of 1 applied to uncertainties, for ease of comparison with other industry handheld
条件:Corrected performance table calculated using uncertainties with a coverage factor of 2.
minute warm-up time. Includes uncertainties due to drift, noise, compression, and dynamic accuracy.
Transmission uncertainty (S21, S12)
Reflection uncertainty (S11, S22)
1 Load match and transmission tracking are typical values
N9950/1/2D, 85562A, full 2-port Cal, DUT
2.92 mm, spec
Corrected performance (dB) 0.3 to 7 MHz 7 MHz to 4 GHz 4 to 20 GHz 20 to 26.5 GHz
26.5 to 40 GHz
Directivity 40 36 28 28
26
Source match 33 33 27 24
23
Load match 1 34 32 27 24
23
Reflection tracking ±0.004 ±0.019 ±0.005 ±0.029
±0.076
Transmission tracking 1 ±0.081 ±0.083 ±0.117 ±0.140
±0.148
Uncertainty plots: power level of -15 dBm
10 Hz IF bandwidth, no averaging, battery saver off, and 60-
Coverage factor of 1 applied to uncertainties, for ease of comparison with other industry handheld
条件:Corrected performance table calculated using uncertainties with a coverage factor of 2.
minute warm-up time. Includes uncertainties due to drift, noise, compression, and dynamic accuracy.
Transmission uncertainty (S21, S12)
Reflection uncertainty (S11, S22)
1 Load match and transmission tracking are typical values
N9950/1/2D, BN 534913, full 2-port Cal, DUT
2.92 mm, spec
Corrected performance (dB) 0.3 to 7 MHz 7 MHz to 4 GHz 4 to 20 GHz 20 to 26.5 GHz
26.5 to 44 GHz
Directivity 47 35 30 25
19
Source match 32 34 28 23
18
Load match 1 29 32 27 23
17
Reflection tracking ±0.073 ±0.002 ±0.025 ±0.021
±0.204
Transmission tracking 1 ±0.125 ±0.123 ±0.141 ±0.148
±0.228
Uncertainty plots: power level of -15 dBm
10 Hz IF bandwidth, no averaging, battery saver off, and 60-
Coverage factor of 1 applied to uncertainties, for ease of comparison with other industry handheld
条件:Corrected performance table calculated using uncertainties with a coverage factor of 2.
minute warm-up time. Includes uncertainties due to drift, noise, compression, and dynamic accuracy.
Transmission uncertainty (S21, S12)
Reflection uncertainty (S11, S22)
1 Load match and transmission tracking are typical values
N9950/1/2D, BN 534914, full 2-port Cal, DUT
2.92 mm, spec
Corrected performance (dB) 0.3 to 7 MHz 7 MHz to 4 GHz 4 to 20 GHz 20 to 26.5 GHz
26.5 to 44 GHz
Directivity 45 30 29 25
19
Source match 33 29 28 23
18
Load match 1 32 29 25 22
18
Reflection tracking ±0.015 ±0.007 ±0.006 ±0.011
±0.208
Transmission tracking 1 ±0.103 ±0.102 ±0.156 ±0.144
±0.189
Uncertainty plots: power level of -15 dBm
10 Hz IF bandwidth, no averaging, battery saver off, and 60-
Coverage factor of 1 applied to uncertainties, for ease of comparison with other industry handheld
条件:Corrected performance table calculated using uncertainties with a coverage factor of 2.
minute warm-up time. Includes uncertainties due to drift, noise, compression, and dynamic accuracy.
Transmission uncertainty (S21, S12)
Reflection uncertainty (S11, S22)
1 Load match and transmission tracking are typical values
N9950/1/2B, N4692D ECal Option 0DC, full 2-port Cal, DUT
2.92 mm, spec
Corrected performance (dB) 1 0.3 to 7 MHz 7 MHz to 4 GHz 4 to 20 GHz 20 to 26.5 GHz
26.5 to 40 GHz
Directivity 40 38 38 35
32
Source match 32 31 31 287
26
Load match 2 32 30 30 27
26
Reflection tracking ±0.011 ±0.012 ±0.012 ±0.018
±0.014
Transmission tracking 2 ±0.083 ±0.094 ±0.088 ±0.095
±0.094
Uncertainty plots: power level of -15 dBm
10 Hz IF bandwidth, no averaging, battery saver off, and 60-
Coverage factor of 1 applied to uncertainties, for ease of comparison with other industry handheld
条件:Corrected performance table calculated using uncertainties with a coverage factor of 2.
minute warm-up time. Includes uncertainties due to drift, noise, compression, and dynamic accuracy.
Transmission uncertainty (S21, S12) – N4692D ECal Option
0DC
Reflection uncertainty (S11, S22) – N4692D ECal Option
0DC
1 When applied power exceeds
-10 dBm, calibration results will be degraded from the performance indicated in this table
2 Load match and transmission tracking are typical values
N9950/1/2D, N4692D ECal Option 010, full 2-port Cal, DUT
2.92 mm, spec
Corrected performance (dB) 1 10 MHz to 4 GHz 4 to 20 GHz 20 to 26.5 GHz
26.5 to 40 GHz
Reflection tracking ±0.010 ±0.012 ±0.018
±0.014
Transmission tracking 2 ±0.193 ±0.088 ±0.095
±0.094
Uncertainty plots: power level of -15 dBm
10 Hz IF bandwidth, no averaging, battery saver off, and 60-
Coverage factor of 1 applied to uncertainties, for ease of comparison with other industry handheld
条件:Corrected performance table calculated using uncertainties with a coverage factor of 2.
minute warm-up time. Includes uncertainties due to drift, noise, compression, and dynamic accuracy.
Transmission uncertainty (S21, S12) – N4692D ECal Option
010
Reflection uncertainty (S11, S22) – N4692D ECal Option
010
1 When applied power exceeds
-10 dBm, calibration results will be degraded from the performance indicated in this table
2 Load match and transmission tracking are typical values
N9950/1/2D, N4693D ECal Option 010, full 2-port Cal, DUT
2.4 mm, spec
Corrected performance (dB) 1 10 MHz to 4 GHz 4 to 20 GHz 20 to 26.5 GHz
26.5 to 50 GHz
Reflection tracking ±0.015 ±0.012 ±0.007
±0.007
Transmission tracking 2 ±0.247 ±0.053 ±0.056
±0.052
Uncertainty plots: power level of -15 dBm
10 Hz IF bandwidth, no averaging, battery saver off, and 60-
Coverage factor of 1 applied to uncertainties, for ease of comparison with other industry handheld
条件:Corrected performance table calculated using uncertainties with a coverage factor of 2.
minute warm-up time. Includes uncertainties due to drift, noise, compression, and dynamic accuracy.
Transmission uncertainty (S21, S12) – N4693D ECal Option
010
Reflection uncertainty (S11, S22) – N4693D ECal Option
010
1 When applied power exceeds
-10 dBm, calibration results will be degraded from the performance indicated in this table
2 Load match and transmission tracking are typical values
N9953D, 85058E, full 2-port Cal, DUT
1.85 mm, spec
Corrected performance (dB) 0.3 to 7 MHz 7 MHz to 4 GHz 4 to 26.5 GHz 26.5 to 50 GHz
50 to 54 GHz
Directivity 35 35 29 26
26
Source match 32 31 27 24
24
Load match 1 28 30 27 23
23
Reflection tracking ±0.028 ±0.01 ±0.014 ±0.032
±0.01
Transmission tracking 1 ±0.126 ±0.124 ±0.107 ±0.097
±0.254
Uncertainty plots: power level of -15 dBm
10 Hz IF bandwidth, no averaging, battery saver off, and 60-
Coverage factor of 1 applied to uncertainties, for ease of comparison with other industry handheld
条件:Corrected performance table calculated using uncertainties with a coverage factor of 2.
minute warm-up time. Includes uncertainties due to drift, noise, compression, and dynamic accuracy.
Transmission uncertainty (S21, S12)
Reflection uncertainty (S11, S22)
1 Load match and transmission tracking are typical values
N9953D, N4694D 0DC ECal, full 2-port Cal, DUT
1.85 mm, spec
Corrected performance (dB) 1 0.3 to 7 MHz 7 MHz to 4 GHz 4 to 26.5 GHz 26.5 to 50 GHz
50 to 54 GHz
Directivity 41 41 41 38
35
Source match 33 33 33 30
28
Load match 2 33 33 33 29
27
Reflection tracking ±0.011 ±0.011 ±0.011 ±0.014
±0.015
Transmission tracking 1 ±0.076 ±0.075 ±0.051 ±0.049
±0.157
Uncertainty plots: power level of -15 dBm
10 Hz IF bandwidth, no averaging, battery saver off, and 60-
Coverage factor of 1 applied to uncertainties, for ease of comparison with other industry handheld
条件:Corrected performance table calculated using uncertainties with a coverage factor of 2.
minute warm-up time. Includes uncertainties due to drift, noise, compression, and dynamic accuracy.
Transmission uncertainty (S21, S12) – N4694D ECal Option
0DC
Reflection uncertainty (S11, S22) – N4693D ECal Option
0DC
1 When applied power exceeds
-10 dBm, calibration results will be degraded from the performance indicated in this table.
2 Load match and transmission tracking are typical values
N9953D, N4694D 010 ECal, full 2-port Cal, DUT
1.85 mm, spec
Corrected performance (dB) 1 10 MHz to 4 GHz 4 to 26.5 GHz 26.5 to 50 GHz
50 to 54 GHz
Reflection tracking ±0.023 ±0.011 ±0.014
±0.015
Transmission tracking 2 ±0.258 ±0.051 ±0.049
±0.157
Uncertainty plots: power level of -15 dBm
10 Hz IF bandwidth, no averaging, battery saver off, and 60-
Coverage factor of 1 applied to uncertainties, for ease of comparison with other industry handheld
条件:vector voltmeter sections apply to the capabilities available in the following models:
Transmission uncertainty (S21, S12) – N4694D ECal Option
010
Reflection uncertainty (S11, S22) – N4693D ECal Option
010
1 When applied power exceeds
-10 dBm, calibration results will be degraded from the performance indicated in this table.
2 Load match and transmission tracking are typical values
TDR Cable Measurements (Option
215)
The performance listed in TDR cable measurements, VNA time domain, mixed-mode S-parameters and
FieldFox microwave (combination) analyzers N9916D, N9917D, N9918D
条件:The TDR cable option adds time domain reflectometry (TDR) measurements to FieldFox’s CAT mode.
FieldFox’s TDR measurements are based on an inverse Fourier transform of the frequency-domain data.
TDR measurements are useful in not only identifying the location of faults along cables, but also the
nature of the fault. Resistive, inductive and capacitive faults will each have a different response. These
differences help engineers and technicians’ trouble-shoot line faults.
X-axis: distance (meters or feet)
VNA Time Domain (Option
010)
In time-domain mode, FieldFox computes the inverse Fourier transform of the frequency-domain data to
Gating Start, stop, center, span, and on/off
Numbers of points, velocity vector, line loss, window shape, independent control for all four traces
条件:domain data should extend from DC (extrapolated value) to a higher value.
Low-pass impulse Low-pass impulse response is used to measure low-pass devices.
Low-pass step Low-pass step is similar to a traditional time domain reflectometer (TDR)
stimulus waveform. It is used to measure low-pass devices. The frequency-
Bandpass impulse The bandpass impulse simulates a pulsed RF signal and is used to measure
The windowing function can be used to filter the frequency domain data and thereby reduce overshoot and ringing
in the time domain response
Windows Minimum, medium and maximum, manual entry of Kaiser Beta and impulse
The gating function can be used to selectively remove reflection or transmission time domain responses. In
converting back to the frequency domain, the effects of the responses outside the gate are removed. The results
Gate shapes 最大值, wide, 正常, 最小值
Mixed-Mode S-Parameters (Option
212)
Mixed-mode S-parameters are also known as balanced measurements.
Scc11 Common mode reflection
Sdd11 Differential mode reflection
Scd11 Differential mode stimulus, common mode response
Sdc11 Common mode stimulus, differential mode response
FieldFox’s mixed-mode S-parameter measurements require the use of the default factory calibration or a
user 2-port calibration. So, the FieldFox analyzer must be equipped with 2-port measurement functionality
to measure mixed-mode S-parameters. Mixed-mode S-parameters are an extension of the VNA
条件:device measurements. The results are shown on a large display in digital format.
Vector Voltmeter (VVM) (Option
308)
With vector voltmeter mode, you can characterize the difference between two measurements easily. The
zeroing function allows you to create a reference signal and characterize the difference between two
N991xD
N995xD
Setup parameters 1-port cable trimming Reflection (S11 or S22 measurement), magnitude and phase
2-port transmission Transmission or S21 measurement, magnitude, and phase
Ratio of two receivers or channels, magnitude, and phase – Need an
IF bandwidth
10 Hz to 100 kHz or 3 Hz to 30 kHz
Must zero before measuring DUT. Recommend using a high-quality power splitter or 6 dB attenuators to
N991xD 100 kHz to 2 GHz
±0.2
N995xD 300 kHz to 2 GHz
±0.2
Spectrum Analyzer (Option
233 on Combination
FieldFox microwave (combination) analyzers: N9916D, N9917D, N9918D
适用型号 N9950D, N9951D, N9952D, N9953D
FieldFox microwave signal analyzers: N9936D, N9937D, N9938D
条件:Accuracy, when locked to GPS ±0.01 ppm (nominal)
Accuracy, when GPS antenna is disconnected ±0.4 ppm (nominal) 2
• 16% x RBW, step mode (nominal)
Series Models Frequency range
1 Supplemental information
N991xD, N993xD
N9916D, N9936D
9 kHz to 14 GHz Usable to 5 kHz
N9917D, N9937D
9 kHz to 18 GHz Usable to 5 kHz
N9918D, N9938D
9 kHz to 26.5 GHz Usable to 5 kHz
N995xD, N996xD N9950D, N9960D
9 kHz to 32 GHz Usable to 5 kHz
N9951D, N9961D
9 kHz to 44 GHz Usable to 5 kHz
N9952D, N9962D
9 kHz to 50 GHz Usable to 5 kHz
N9953D, N9963D
9 kHz to 54 GHz Usable to 5 kHz
Frequency reference
-10 to 55 °C
Accuracy
±0.9 ppm (spec) + aging
±0.5 ppm (typical) + aging
Aging rate ±1 ppm/yr for 20 years (spec), will not exceed
±3.5 ppm
Frequency readout accuracy (start, stop, center, marker) ± (readout frequency x frequency reference accuracy
+ RBW centering +
0.5 x horizontal resolution)
Horizontal resolution = frequency span/(trace points – 1)
• 5% x RBW, FFT mode (nominal)
Accuracy ± (marker frequency x frequency reference accuracy + counter resolution)
1 The spectrum analyzer is tunable to 0 Hz or DC .
2 The maximum drift expected in the frequency reference applicable when the ambient temperature changes
±5 °C from the
条件:finish, including time to tune receiver, acquire data, and process trace.
Trace update N991xD, N993xD, N995xD, N996xD (nominal)
Center frequency tune and transfer 1 N991xD, N993xD (nominal) N995xD, N996xD (nominal)
Sweep time, zero span N991xD, N993xD, N995xD, N996xD (nominal)
Range 0 Hz (zero span)
10 Hz to maximum frequency range of instrument
Accuracy ± (2 x RBW centering + horizontal resolution) for detector = Normal
Sweep time readout Measured value of the time required to complete a sweep from start to
Span = 20 MHz, RBW, VBW = 3 kHz
16 updates per second
autocoupled
35 updates per second
Span = 10 GHz, RBW =
1 MHz, VBW
autocoupled Approximately
2.2 updates per second
101 points, zero span 30 ms
32 ms
101 points, 1 MHz span 27 ms
33 ms
101 points, 100 MHz span 30 ms
32 ms
Readout Entered value representing trace horizontal scale range
触发斜率 Positive 边沿, negative 边沿
Trigger delay Range
-150 ms to 10 s
Auto trigger Forces a periodic acquisition in the absence of a trigger event
Controls horizontal position of the pulse edge; use sweep time to zoom
Range: 0 to 10, integer steps; 0 is left edge of graticule
10 is right edge of
Operating frequency range
20 MHz to maximum instrument frequency
条件:Resolution Bandwidth (RBW) Nominal
All spans 101, 201, 401, 601, 801
1001 (defaults to 401)
Arbitrary 2 to 20,001 settable through soft key “# Points” or SCPI
1 Within full frequency range of instrument, not band dependent .
Range (-3 dB bandwidth)
Zero span 10 Hz to 5 MHz 1, 3
10 sequence
Non-zero span 1 Hz to 5 MHz 1, 1.5, 2, 3, 5, 7.5
10 sequence <
300 kHz, 300 kHz, 1 MHz, 3 MHz
5
MHz (Other RBWs may be set depending on settings)
Step keys change RBW in 1, 3
10
Selectivity (−60 dB / −3 dB)
4:1
Zero span 10 Hz to 1 MHz ±5% 3 MHz ±10% 5 MHz
±15%
Non-zero span 1 Hz to 100 kHz ±1% 300 kHz to 1 MHz ±5% 3 MHz
±10%
Video Bandwidth (VBW) 1 Hz to 5 MHz 1, 1.5, 2, 3, 5, 7.5
10 sequence
Measurement range DANL to +20 dBm
Input attenuator range
0 to 40 dB, in 5 dB steps
Frequency range Full band (9 kHz to maximum
Gain N991xD, N993xD +15 dB
9 kHz to 7.5 GHz
N995xD, N996xD +15 dB
9 kHz to 7.5 GHz
最大 safe 输入电平 Average CW 功率 DC
N991xD, N993xD +27 dBm, 0.5 watts
±50 VDC
N995xD, N993xD +25 dBm, 0.3 watts
±40 VDC
0.01 to 100 dB/division in 0.01 dB steps
Scale units dBm, dBmV, dBµV, dBmA, dBµA, W, V, A, dBµV/m, dBµA/m, dBG, dBT
50 MHz absolute amplitude accuracy (dB)
10 dB attenuation, input signal -40 to -5 dBm, peak detector, preamplifier off
300 Hz RBW, all settings auto-
条件:Total absolute amplitude accuracy (dB) with preamp off 10 dB attenuation, input signal -15 to -5 dBm, peak detector, 300 Hz RBW, all settings auto-coupled, includes frequency response uncertainties. No warm-up required.
≥ 50 to 54 GHz ±1.70 ±0.30 ±2.35 (nominal)
adapter, there are nominally four modes between 18 GHz and 26.5 GHz. The effect of these modes is included within these specifications.
RBW, all settings auto-coupled, includes frequency response uncertainties. No warm-up required.
≥ 50 to 54 GHz ±1.70 ±0.35 ±2.80 (nominal)
Resolution bandwidth switching uncertainty Nominal
RF input VSWR Frequency range Nominal
N991xD, N993xD Spec (23 ±5 °C) Typical (23
±5 °C) Typical (-10 to 55 °C)
N995xD, N996xD ±0.50 ±0.15
±0.20
Spec (23 ±5 °C) Typical (23
±5 °C) Typical (-10 to 55 °C)
N991xD, N993xD
with preamp off 9 to 100 kHz ±1.70 ±0.25
±0.75
> 0.1 to 50 MHz ±0.70 ±0.10
±0.20
> 50 to 500 MHz ±0.70 ±0.15
±0.30
> 0.5 to 16.3 GHz ±0.90 ±0.25
±0.45
> 16.3 to 18 GHz ±0.80 ±0.20
±0.35
> 18 to 26.5 GHz2 ±0.90 ±0.25
±0.50
N995xD, N996xD
with preamp off 9 to 500 kHz ±1.50 ±0.45
±1.80
≥ 0.5 to 15 MHz ±0.80 ±0.15
±0.55
≥ 15 MHz to 18 GHz ±1.00 ±0.20
±0.45
≥ 18 to 26.5 GHz ±1.20 ±0.20
±0.35
≥ 26.5 to 32 GHz ±1.30 ±0.30
±0.60
≥ 32 to 36 GHz ±1.50 ±0.35
±0.85
≥ 36 to 44 GHz ±1.90 ±0.35
±0.65
≥ 44 to 50 GHz ±1.70 ±0.35
±0.60
1 The spec and typical values, with preamp on, are identical to that with preamp off, but the input signal levels are
-40 to
- 20 dBm.
2 N9938D units with Type-N connectors are tested using a system calibrated in 3.5 mm, with a precision
3.5 mm to Type-N adapter. With this
Total absolute amplitude accuracy (dB) with preamp on (Option
235 required and turned on)
20 dB attenuation, input signal -25 to -15 dBm for N991xD/3xD or -20 dBm for N995xD/6xD, peak detector
300 Hz
Spec (23 ±5 °C) Typical (23
±5 °C) Typical (-10 to 55 °C)
N991xD, N993xD
with preamp on 9 to 300 kHz ̶ ±0.40
±1.60
> 0.3 to 50 MHz ±0.70 ±0.15
±0.25
> 50 to 500 MHz ±0.70 ±0.15
±0.30
> 0.5 to 16.3 GHz ±0.90 ±0.25
±0.50
> 16.3 to 18 GHz ±0.90 ±0.25
±0.30
> 18 to 26.5 GHz2 ±1.00 ±0.25
±0.60
N995xD, N996xD
with preamp on 9 to 500 kHz ̶ ±1.10
±2.30
≥ 0.5 to 15 MHz ±0.90 ±0.15
±0.50
≥ 15 MHz to 18 GHz ±1.00 ±0.20
±0.50
≥ 18 to 26.5 GHz ±1.10 ±0.20
±0.40
≥ 26.5 to 32 GHz ±1.20 ±0.25
±0.65
≥ 32 to 36 GHz ±1.40 ±0.35
±0.85
≥ 36 to 44 GHz ±1.70 ±0.35
±0.70
≥ 44 to 50 GHz ±1.70 ±0.35
±0.70
For signals not at center frequency
0.7 dB peak-to-peak
N991xD, N993xD (0 dB attenuation)
> 7.5 to 26.5 GHz 2.0
1
N995xD, N996xD (0 dB attenuation)
> 7.5 to 26.5 GHz 2.0
1
Detectors Normal, positive peak, negative peak, sample, average (RMS)
States Clear/write, max hold, min hold, average, view, blank
Number of averages
1 to 10,001
Number 4: all four can be active simultaneously and in different states
Audio beep Volume and tone change with signal strength
Marker table Display
6 markers
Peak, next peak, peak left, peak right, center frequency, reference level,
条件:1 Hz RBW, measured at non-zero frequency span
Input terminated, RMS detection, log averaging
0 dB input attenuation, reference level of -20 dBm, normalized to
N991xD, N993xD Spec
Typical (-10 to 55 °C)
Typical (-10 to 55 °C) 9 kHz to 2 MHz -118 -136 -133 -125 -150
-146
> 2 MHz to 2.1 GHz -139 -148 -146 -156 -164
-162
> 2.1 to 2.6 GHz -140 -146 -143 -155 -160
-159
> 2.6 to 4.5 GHz -142 -148 -145 -156 -163
-160
> 4.5 to 7.5 GHz -138 -146 -143 -153 -160
-158
> 7.5 to 13 GHz -139 -145 -142 -157 -162
-160
> 13 to 18 GHz -135 -142 -139 -153 -159
-158
> 18 to 22 GHz -134 -140 -137 -153 -158
-157
> 22 to 25 GHz -130 -138 -135 -150 -157
-155
> 25 to 26.5 GHz -128 -134 -131 -147 -154
-152
条件:1 Hz RBW, measured at non-zero frequency span
Input terminated, RMS detection, log averaging
0 dB input attenuation, reference level of -20 dBm, normalized to
条件:Residual responses (dBm) Nominal
Input related responses (dBc) Nominal
Tuned frequency (f) Excitation frequency Spur frequency Nominal
Tuned frequency (f) Excitation frequency Spur frequency Nominal
Other spurious responses (dBc) Nominal Nominal
Second harmonic distortion Nominal Nominal
N995xD, N996xD Spec
Typical (-10 to 55 °C)
Typical (-10 to 55 °C) 9 kHz to 2 MHz -88 -126 -120 -94 -140
-132
≥ 0.002 to 2.1 GHz -138 -149 -147 -156 -163
-162
≥ 2.1 to 7.5 GHz -140 -148 -146 -156 -161
-160
≥ 7.5 to 13 GHz -143 -148 -146 -155 -160
-159
≥ 13 to 26.5 GHz -132 -143 -140 -145 -155
-153
≥ 26.5 to 32 GHz -144 -151 -148 -154 -159
-158
≥ 32 to 40 GHz -135 -145 -142 -148 -155
-153
≥ 40 to 44 GHz -130 -139 -136 -143 -151
-148
≥ 44 to 50 GHz -118 -133 -130 -131 -144
-141
≥ 50 to 54 GHz -113 -126 -121 -126 -138
-133
Input terminated preamp off
0 dB attenuation
N991xD, N993xD
N995xD, N996xD 9 kHz to 9 MHz
-90
1 Excludes
5.625 MHz at -85 dBm
2 Excludes
18 GHz at -90 dBm
N991xD, N993xD
−30 dBm signal at mixer input (excludes frequencies listed below)
-80
f ≥ 2.6 to 7.5 GHz f + 2 * 9.93375 GHz f
-65
f ≥ 9.5 to 15.7 GHz f + 2 * 3.56625 GHz f
-75
f ≥ 19.5 to 23 GHz f - 2 * 3.56625 GHz f
-60
f ≥ 23 to 26.5 GHz f - 2 * 3.56625 GHz f
-55
f ≥ 2.6 to 7.5 GHz f + 9.93375 GHz / 2 f
-65
fOffset = frequency offset of excitation frequency from tuned frequency (f)
f < 2.6 GHz, f >
7.5 GHz to 19.5 GHz
f + fOffset f - n * fOffset, (n = 1, 2, 3, …)
-75
f + fOffset f - 2 * (5.625 MHz +/- fOffset)
-70
f > 2.6 GHz to 7.5 GHz, f > 19.5 GHz f + fOffset f - n * fOffset, (n = 1, 2, 3, …)
-75
f + fOffset f + 2 * (5.625 MHz +/- fOffset)
-70
N995xD, N996xD
−30 dBm signal at mixer input (excludes frequencies listed below)
-85
f ≥ 12.3 to 15.7 GHz f + 2 * 3.56625 GHz f
-75
f > 19.5 to 26.5 GHz f - 2 * 3.56625 GHz f
-55
f ≥ 26.5 to 32.5 GHz f + 2 * 3.56625 GHz f
-70
f > 32.5 to 39.5 GHz f - 2 * 3.56625 GHz f
-55
f > 39.5 to 43 GHz f - 2 * 3.56625 GHz f
-50
f > 43 to 46.2 GHz f + 2 * 3.56625 GHz f
-45
f > 46.2 to 54 GHz f - 2 * 3.56625 GHz f
-45
f ≥ 2.6 to 7.5 GHz f + 9.93375 GHz / 2 f
-75
f ≥ 9.5 to 12.3 GHz f + 3.56625 GHz / 2 f
-75
f ≥ 19.5 to 23 GHz f - 3.56625 GHz / 2 f
-80
f ≥ 26.5 to 29 GHz f + 3.56625 GHz / 2 f
-60
f ≥ 29 to 32.5 GHz f + 3.56625 GHz / 2 f
-65
f ≥ 32.5 to 36 GHz f - 3.56625 GHz / 2 f
-55
f ≥ 36 to 39.5 GHz f - 3.56625 GHz / 2 f
-60
f ≥ 39.5 to 43 GHz f - 3.56625 GHz / 2 f
-65
f ≥ 43 to 46.2 GHz f + 3.56625 GHz / 2 f
-75
f ≥ 46.2 to 50 GHz f - 3.56625 GHz / 2 f
-75
f ≥ 50 to 54 GHz f - 3.56625 GHz / 2 f
-80
fOffset = frequency offset of excitation frequency from tuned frequency (f)
-80
f >
7.5 GHz to 19.5 GHz
f >
26.5 GHz to 32.5 GHz
f + fOffset f - n * fOffset, (n = 1, 2, 3, …)
-75
f + fOffset f - 2 * (5.625 MHz +/- fOffset)
-70
f >
19.5 GHz to 26.5 GHz
f + fOffset f - n * fOffset, (n = 1, 2, 3, …)
-75
f + fOffset f + 2 * (5.625 MHz +/- fOffset)
-70
N991xD, N993xD N995xD, N996xD
LO related spurs 9 kHz to 13 GHz -75
-75
Battery charging sideband 1 -70
-70
-30 dBm signal at mixer input SHI (dBm) Distortion (dBc)
N991xD, N993xD
> 50 MHz to 1.3 GHz +50
-80
≥ 3.75 to 13.25 GHz +50
-80
N995xD, N996xD
> 100 MHz to 1.3 GHz +50
-80
1 Charging sidebands will only occur when battery is being charged. The charging sidebands will have an offset between
50 kHz
and 350 kHz and they may have harmonics.
条件:Spur free dynamic range (dB) at 2.4 GHz 2/3 (TOI – DANL) Nominal
Two -15 dBm signals, 100 kHz spacing at mixer input Typical (23
±5 °C) Typical (-10 to 55 °C)
N991xD, N993xD
≥ 20 to 26.5 GHz +17
+15.5
Two -15 dBm signals, 100 kHz spacing at mixer input 1 Typical (23
±5 °C) Typical (-10 to 55 °C)
N995xD, N996xD 50 MHz to 500 MHz +11.5
+9.5
≥ 500 MHz to 2.4 GHz +12
+9.5
≥ 2.4 to 2.6 GHz +16.5
+14.5
≥ 9.5 to 16.3 GHz +10.5
+7.5
≥ 16.3 to 19.5 GHz +12.5
+9
≥ 19.5 to 23 GHz +15
+12.5
≥ 23 to 26.5 GHz +16.5
+13.5
1 From 23 GHz to 54 GHz, tested with tone spacing of 2 MHz.
Distortion and noise limited (10 Hz RBW) dynamic range
Applies to N991xD and N993xD
-140
-130
-120
-110
-100
-90
-80
-70
-60
-50
-40
-80 -70 -60 -50 -40 -30 -20
-10
Distortion and noise limited (10 Hz RBW) dynamic range
Applies to N995xD and N995xD
-140
-130
-120
-110
-100
-90
-80
-70
-60
-50
-40
-80 -70 -60 -50 -40 -30 -20
-10
SSB phase noise at 1 GHz center frequency
条件:Phase noise at different center frequencies (nominal)
Phase noise at different center frequencies (nominal)
Dynamic range versus offset frequency versus RBW (nominal) 1
SSB phase noise at 1 GHz carrier frequency
N991xD, N993xD N995xD, N996xD
Typical (-10 to 55 °C)
Typical (-10 to 55 °C) 10 kHz -107 -112 -111 -107 -111 -111 30 kHz -110 -113 -113 -110 -113
-112
100 kHz -106 -110 -110 -105 -110
-110
1 MHz -121 -125 -124 -118 -124
-124
3 MHz1 -126 -130 -128 -125 -131
-129
5 MHz2 -124 -129 -128 -126 -130
-129
Applies to N991xD and N993xD
1 Tested at 2.99 MHz.
2 Tested at 4.99 MHz.
Applies to N995xD and N996xD
Applies to N991xD, N993xD
Applies to N995xD, N996xD
1 For 1 MHz RBW, the sideband observed may degrade the dynamic range to -70 dBc .
FieldFox microwave (combination) analyzers: N9916D, N9917D, N9918D
适用型号 N9950D, N9951D, N9952D, N9953D
FieldFox microwave signal analyzers: N9936D, N9937D, N9938D
Note: Traditional tracking generators track the receiver frequency only. In FieldFox analyzers, the tracking
generator frequency can be set to either track the receiver frequency, or act as an independent CW
Series Models Tracking generator or independent source frequency range
N991xD, N993xD
N9916D, N9936D
30 kHz to 14 GHz
N9917D, N9937D
30 kHz to 18 GHz
N9918D, N9938D
30 kHz to 26.5 GHz
N995xD, N996xD
N9950D, N9960D
300 kHz to 32 GHz
N9951D, N9961D
300 kHz to 44 GHz
N9952D, N9962D
300 kHz to 50 GHz
N9953D, N9963D
300 kHz to 54 GHz
Power settable in 1 dB steps across power range
Mode Continuous Wave (CW), CW coupled, tracking (swept frequency)
Operations Normalization, frequency offset, spectral reversal
条件:Power level accuracy 1 Frequency Port 1 at -15 dBm (nominal)
Dynamic range (dB) Frequency Typical (−10 to 55 °C) Nominal
The performance listed in this section applies to the real-time spectrum analyzer capabilities available in
N991xD, N993xD
N995xD, N996xD
N991xD, N993xD > 500 kHz to 10 MHz
±1 dB
> 10 MHz to 26.5 GHz
±0.5 dB
N995xD, N996xD > 300 kHz to 54 GHz
±0.5 dB
1 Power levels are calibrated based on PNA- X tuned receiver for the entire frequency range.
N991xD, N993xD
Preamp OFF Preamp ON 300 kHz to 2 MHz 91
104
> 2 MHz to 2.6 GHz 98
112
N995xD, N996xD 500 kHz to 100 MHz 96
109
> 100 MHz to 17.5 GHz 97
109
> 23.8 to 26.6 GHz 72
84
> 26.6 to 37.5 GHz 94
100
> 37.5 to 41.5 GHz 89
98
Real-Time Spectrum Analyzer (RTSA) (Option
350)
FieldFox microwave (combination) analyzers N9916D, N9917D, N9918D
适用型号 N9950D, N9951D, N9952D, N9953D
FieldFox microwave signal analyzers N9936D, N9937D, N9938D
Series Models Real-time analysis frequency range
1
N991xD, N993xD
N9916D, N9936D
9 kHz to 14 GHz Usable to 5 kHz
N9917D, N9937D
9 kHz to 18 GHz Usable to 5 kHz
N9918D, N9938D
9 kHz to 26.5 GHz Usable to 5 kHz
N995xD, N996xD
N9950D, N9960D
9 kHz to 32 GHz Usable to 5 kHz
N9951D, N9961D
9 kHz to 44 GHz Usable to 5 kHz
N9952D, N9962D
9 kHz to 50 GHz Usable to 5 kHz
N9953D, N9963D
9 kHz to 54 GHz Usable to 5 kHz
条件:Spurious-free dynamic range (nominal) 69 dB 65 dB 63/62 dB
Measurements Density spectrum, spectrogram, real-time spectrum
Maximum real-time bandwidth 10 MHz (standard) 40 MHz (Option B04)
100/120 MHz (Option B10)
Resolution bandwidth (Span dependent, 20 ≤ Span/RBW ≤ 280) 1 Hz to 500 kHz 1 Hz to 2 MHz
1 Hz to 5 MHz
Minimum signal duration with 100%
Probability Of Intercept (POI) at full amplitude accuracy 9.13 us 6.13 us
5.52 us
Minimum detectable signal 2 11 ns 11 ns
47 ns
Min. acquisition time (density spectrum) 20 ms 20 ms
20 ms
Min. acquisition time (spectrogram) 500 µs/div 500 µs/div
500 µs/div
Max. acquisition time (density spectrum) 540 ms 337 ms
336 ms
Max. acquisition time (spectrogram) 10 s/div 10 s/div
10 s/div
条件:Traces 1 Performance specified above 1 MHz. Usable down to 5 kHz . 2 Minimum detectable pulse width is the shortest pulse width of a pulsed CW signal that will display a peak amplitude that is no worse than 60 dB below the peak amplitude of a CW signal of the same power level for a defined span and auto- coupled RBW.
≥ 1 MHz) 0.1 dB (typical) 0.1 dB (typical)
0.1 dB (typical)
Number of display points
821
Number of traces 4 (all four can be active simultaneously and in different states)
Detectors Normal, positive peak, negative peak, sample, average (RMS)
States Clear/write, max. hold, min. hold, average, view, blank
Trigger type Free run, external, video, RF burst, periodic
条件:The specifications in this section apply to the I/Q analyzer capabilities available in the following models:
I/Q Analyzer (IQA) (Option
351)
FieldFox microwave (combination) analyzers: N9916D, N9917D, N9918D
适用型号 N9950D, N9951D, N9952D, N9953D
FieldFox microwave signal analyzers: N9936D, N9937D, N9938D
Series Models I/Q analysis frequency range
1
N991xD, N993xD
N9916D, N9936D
9 kHz to 14 GHz
N9917D, N9937D
9 kHz to 18 GHz
N9918D, N9938D
9 kHz to 26.5 GHz
N995xD, N996xD
N9950D, N9960D
9 kHz to 32 GHz
N9951D, N9961D
9 kHz to 44 GHz
N9952D, N9962D
9 kHz to 50 GHz
N9953D, N9963D
9 kHz to 54 GHz
I/Q waveform (Dual simultaneous top and bottom windows: I vs. time and Q
• Time summary table showing I/Q capture settings: I/Q capture time, waveform start/stop, Spectrum FFT time
1 Performance specified above
1 MHz. Usable down to 5 kHz .
条件:Maximum BW of 120 MHz with Option B10 over the SFP+ or Ethernet port in either VITA
I/Q capture parameters Capture time, sample rate, sample period, capture samples
I/Q streaming (requires option
353)
49A or Decodio formats
Bandwidth options 10 MHz (standard) 40 MHz (Option B04)
120 MHz (Option B10)
Frequency span 10 Hz to 10 MHz 10 Hz to 40 MHz
10 Hz to 120 MHz
Bandwidth options 10 MHz (standard) 40 MHz (Option B04)
100/120 MHz (Option B10)
N991xD, N993xD Typical
(-10 to 55 °C)
Typical (-10 to 55 °C)
Typical (-10 to 55 °C)
Magnitude ±0.09 dB ±0.1 dB
±0.2 dB/±0.3 dB
Phase deviation from linearity
0.5º peak-to-peak
0.2º rms
1.9º peak-to-peak
0.8º rms
11º/14° peak-to-peak
6º/7º rms
Group delay flatness (peak-to-peak) 1 1.4 ns 1.1 ns
2.1 ns/4 ns
N995xD, N996xD Typical Typical Typical
条件:N991xD, N993xD Nominal Nominal Nominal 2
N995xD, N996xD Nominal Nominal Nominal 1
Magnitude ±0.10 dB ±0.15 dB
±0.25 dB/±0.25 dB
Phase deviation from linearity
1.5º peak-to-peak
0.6º rms
1.4º peak-to-peak
0.6º rms
5.5º/7° peak-to-peak
2.4º/3º rms
Group delay flatness (peak-to-peak) 1 5.5 ns 1 ns
1.3 ns/2.1 ns
EVM accuracy 10 MHz (standard) 40 MHz (Option B04)
100/120 MHz (Option B10)
EVM (at center frequency
1 GHz)
LTE-A FDD TM3.1 (10 MHz)
LTE-A FDD TM3.1 (20 MHz)
WCDMA TM4 (5 MHz)
— 0.50%
— 0.65%
— 0.45%
0.45%
0.75%
0.90%
0.45%
0.45%
0.75%
EVM (at center frequency
2.1 GHz)
LTE-A FDD TM3.1 (10 MHz)
LTE-A FDD TM3.1 (20 MHz)
WCDMA TM4 (5 MHz)
0.65%
— 0.80%
0.55%
0.60%
0.85%
0.55%
0.60%
0.85%
EVM (at center frequency
3.5 GHz)
LTE-A FDD TM3.1 (20 MHz) — —
— 0.90%
0.90%
0.90%
EVM (at center frequency
5.8 GHz)
EVM (at center frequency
24 GHz)
EVM accuracy 10 MHz (standard) 40 MHz (Option B04)
100/120 MHz (Option B10)
1 Not guaranteed below
50 MH z
2 Applies when fast channel equalization (default) is OFF
EVM (at center frequency
1 GHz)
LTE-A FDD TM3.1 (10 MHz)
LTE-A FDD TM3.1 (20 MHz)
WCDMA TM4 (5 MHz)
— 0.50%
— 0.60%
— 0.50%
0.50%
0.70%
1.00%
0.50%
0.50%
0.70%
EVM (at center frequency
2.1 GHz)
LTE-A FDD TM3.1 (10 MHz)
LTE-A FDD TM3.1 (20 MHz)
WCDMA TM4 (5 MHz)
0.60%
— 0.85%
0.55%
0.60%
0.90%
0.55%
0.60%
0.90%
EVM (at center frequency
3.5 GHz)
LTE-A FDD TM3.1 (20 MHz) — —
— 0.90%
0.95%
0.90%
EVM (at center frequency
5.8 GHz)
EVM (at center frequency
24 GHz)
EVM (at center frequency
28 GHz)
EVM (at center frequency
39 GHz)
Total capture memory
1024 MB
Length single I/Q capture
8 bytes/sample
Maximum length I/Q capture
128 MSa
Sample rate (I/Q pairs)
1.25 x span
Maximum I/Q capture time 120 MHz span 0.89 s 100 MHz span 1 s 40 MHz span
2.6 s
条件:1 Hz RBW, measured at non-zero frequency span
Input terminated, RMS detection, log averaging
0 dB input attenuation, reference level of -20 dBm, normalized to
N991xD, N993xD
Typical (-10 to 55°C)
Typical (-10 to 55°C) 9 kHz to 2 MHz -119 -137 -136 -124 -150
-149
> 2 to 120 MHz -146 -151 -149 -160 -165
-164
> 0.12 to 2.6 GHz -145 -152 -151 -159 -164
-164
>2.6 to 4.5 GHz -148 -154 -152 -160 -164
-163
> 4.5 to 6.5 GHz -145 -151 -149 -159 -163
-162
> 6.5 to 7.5 GHz -143 -149 -147 -157 -161
-161
> 7.5 to 9 GHz -143 -148 -146 -159 -163
-162
> 9 to 14 GHz -141 -146 -145 -156 -161
-161
> 14 to 16.3 GHz -139 -143 -142 -156 -160
-159
> 16.3 to 18 GHz -137 -142 -141 -155 -159
-158
> 18 to 23 GHz -135 -142 -140 -154 -159
-158
> 23 to 26.5 GHz -131 -138 -136 -150 -156
-155
条件:1 Hz RBW, measured at non-zero frequency span
Input terminated, RMS detection, log averaging
0 dB input attenuation, reference level of -20 dBm, normalized to
N995xD, N996xD
条件:Input related responses (dBc) Nominal
Tuned frequency (f) Excitation frequency Spur frequency Nominal
Tuned frequency (f) Excitation frequency Spur frequency Nominal
Input related responses (dBc), cont’ed Nominal fOffset = frequency offset of excitation frequency from tuned frequency (f) f < 2.6 GHz, f > 7.5 GHz to 19.5
Spur free dynamic range (dB) at 2.4 GHz 2/3 (TOI - DANL) Nominal
Typical (-10 to 55°C)
Typical (-10 to 55°C) 9 kHz to 2 MHz -89 -126 -119 -94 -141
-130
≥ 0.002 to 2.1 GHz -143 -152 -151 -156 -164
-163
≥ 2.1 to 7.5 GHz -143 -152 -150 -154 -162
-161
≥ 7.5 to 13 GHz -142 -150 -148 -151 -161
-160
≥ 13 to 26.5 GHz -133 -144 -142 -146 -156
-154
≥ 26.5 to 32 GHz -145 -153 -152 -150 -159
-158
≥ 32 to 40 GHz -139 -148 -146 -146 -155
-154
≥ 40 to 44 GHz -129 -141 -139 -138 -151
-149
≥ 44 to 50 GHz -120 -135 -132 -132 -144
-142
> 50 to 54 GHz -112 -127 -123 -127 -139
-134
N991xD, N993xD
−30 dBm signal at mixer input (excludes frequencies listed below)
-75
f ≥ 12.3 to 19.5 GHz f + 2 * 3.375 GHz f
-70
f ≥ 19.5 to 23 GHz f - 2 * 3.375 GHz f
-55
f ≥ 23 to 26.5 GHz f - 2 * 3.375 GHz f
-50
f ≥ 2.6 to 7.6 GHz f + 10.125 GHz / 2 f
-65
fOffset = frequency offset of excitation frequency from tuned frequency (f)
f < 2.6 GHz, f >
7.5 GHz to 19.5 GHz
f + fOffset f - fOffset
-70
f + fOffset f - 2 * (37.5 MHz - fOffset)
-65
f + fOffset f + 2 * (112.5 MHz + fOffset)
-60
f > 2.6 GHz to 7.5 GHz, f >
19.5 GHz
f + fOffset f - fOffset
-70
f + fOffset f + 2 * (37.5 MHz - fOffset)
-65
f + fOffset f - 2 * (112.5 MHz + fOffset)
-65
N995xD, N996xD Nominal
−30 dBm signal at mixer input (excludes frequencies listed below)
-80
f ≥ 15.7 to 19.5 GHz f + 2 * 3.375 GHz f
-70
f > 19.5 to 26.5 GHz f - 2 * 3.375 GHz f
-50
f ≥ 26.5 to 29 GHz f + 2 * 3.375 GHz f
-60
f > 29 to 32.5 GHz f + 2 * 3.375 GHz f
-75
f > 32.5 to 36 GHz f - 2 * 3.375 GHz f
-60
f > 36 to 43 GHz f - 2 * 3.375 GHz f
-50
f ≥ 43 to 46.2 GHz f + 2 * 3.375 GHz f
-35
f > 46.2 to 50 GHz f - 2 * 3.375 GHz f
-40
f > 50 to 54 GHz f - 2 * 3.375 GHz f
-45
f ≥ 2.6 to 7.5 GHz f + 10.125 GHz / 2 f
-70
f ≥ 9.5 to 12.3 GHz f + 3.375 GHz / 2 f
-75
f ≥ 26.5 to 29 GHz f + 3.375 GHz / 2 f
-65
f ≥ 29 to 32.5 GHz f + 3.375 GHz / 2 f
-70
f ≥ 32.5 to 36 GHz f - 3.375 GHz / 2 f
-60
f ≥ 36 to 39.5 GHz f - 3.375 GHz / 2 f
-60
f ≥ 39.5 to 43 GHz f - 3.375 GHz / 2 f
-65
f ≥ 43 to 46.2 GHz f + 3.375 GHz / 2 f
-75
f ≥ 46.2 to 50 GHz f - 3.375 GHz / 2 f
-75
GHz f + fOffset f - fOffset -70 f + fOffset f - 2 * (37.5 MHz - fOffset) -65 f + fOffset f + 2 * (112.5 MHz + fOffset)
-60
f + fOffset, (fOffset < 0) f - 6 * (37.5 MHz - fOffset)
-75
f + fOffset, (fOffset > 0) f - 6 * (12.5 MHz + fOffset)
-75
f > 2.6 GHz to 7.5 GHz, f >
19.5
GHz f + fOffset f - fOffset -70 f + fOffset f + 2 * (37.5 MHz - fOffset) -65 f + fOffset f - 2 * (112.5 MHz + fOffset)
-65
f + fOffset, (fOffset > 0) f + 6 * (37.5 MHz - fOffset)
-75
f + fOffset, (fOffset < 0) f + 6 * (12.5 MHz + fOffset)
-75
Third Order Intermodulation distortion (TOI) in dBm Typical (23
±5 °C)
Typical (-10 to 55 °C)
Two -20 dBm signals
100 kHz spacing at mixer input
N991xD, N993xD
Two -20 dBm signals
100 kHz spacing at mixer input1
N995xD, N996xD
≥ 500 MHz to 2.4 GHz +9.5
+8.5
≥ 2.4 to 2.6 GHz +11.5
+11
≥ 16.3 to 19.5 GHz +8.5
+6.5
N991xD, N993xD, N995xD, N996xD >
108
1 From 23 GHz to 54 GHz, tested with tone spacing of 2 MHz
Number of windows & layout 1, 2 (top & bottom)
3 (one top, two bottom), or 4 (quad display)
Number of traces 4, all four traces can be active simultaneously in all windows
Number of markers
6 normal + delta pairs
Type Normal, delta, peak, marker table (up to 6 markers)
Couple markers On/off (couple markers between traces in different windows)
触发斜率 Positive 边沿, negative 边沿
Trigger delay Range
-150 ms to 500 ms
Auto trigger Forces a periodic acquisition in the absence of a trigger event
Data 类型迹线, 迹线+state, picture (PNG)
I/Q capture data file types CSV, text (TXT), SDF (compatible with 89600 VSA software), Matlab (MAT)
I/Q data formats via SCPI Raw binary interleaved I/Q data recording, REAL32 (ASCII is default)
Noise Figure (NF) (Option
356)
The specifications in this section apply to the noise figure measurement capabilities available in the
FieldFox microwave (combination) analyzers: N9916D, N9917D, N9918D
适用型号 N9950D, N9951D, N9952D, N9953D
FieldFox microwave signal analyzers: N9936D, N9937D, N9938D
Series 型号噪声 figure analysis 频率范围
N991xD, N993xD
N9916D, N9936D
10 MHz to 14 GHz
N9917D, N9937D
10 MHz to 18 GHz
N9918D, N9938D
10 MHz to 26.5 GHz
N995xD, N996xD
N9950D, N9960D
10 MHz to 32 GHz
N9951D, N9961D
10 MHz to 44 GHz
N9952D, N9962D
10 MHz to 50 GHz
N9953D, N9963D
10 MHz to 54 GHz
Auto Integration: optimizes gain to avoid compression, and measurement time to achieve jitter goal
Fixed Fixed Integration: the time per point over which the measurement is averaged is fixed
抖动 goal Sets 测量抖动性能 target
Max time / point Allows user to trade-off jitter vs. measurement time
Jitter warning On: displays circles on trace data if jitter goal is
Loss compensation Before DUT, After DUT User definable, compensates measurement for
loss (dB) before and after DUT
条件:Measurement bandwidth (nominal)
Range 5 MHz (default), 3 MHz, 1 MHz
300 kHz
Noise figure uncertainty calculator
1 Supplemental information
Applies single values uniformly across frequency: Input |Γ| and
Output |Γ| Γ specification style: Maximum, 95th percentile
80th
Γ distribution: Rayleigh, Fixed, Uniform in Circle
Table Applies a table of values vs. frequency: Input |Γ| and Output |Γ|
Applies single values uniformly across frequency Input |Γ| and
Output |Γ| Γ specification style: Maximum, 95th percentile
80th
Applies a table of values vs. frequency: Input |Γ| and Output |Γ| Γ
specification style: Maximum, 95th percentile
80th percentile
Spot Applies single values uniformly across frequency: ENR (dB), ENR
Uncertainty (dB), On |Γ|, Off |Γ|, ENR Uncertainty Confidence (SD)
Table Applies a table of values vs. frequency: ENR (dB), ENR
Uncertainty (dB), On |Γ|, Off |Γ|, ENR Uncertainty Confidence (SD)
For U183x USB smart noise sources (SNS) only. When connected
with a USB SNS, FieldFox automatically downloads the ENR table
data from the SNS and applies a table of values vs. frequency:
ENR (dB), ENR Uncertainty (dB), On |Γ|, Off |Γ|, ENR Uncertainty
Jitter Random independent events (fluctuations) within the bandwidth
occurring during the noise measurement
ENR Excess noise ratio of the hot noise source connected to the DUT
Mismatch Errors resulting from reflections due to impedance differences
Errors due to the optional user calibration which is performed with a
defined noise standard (ENR source) connected to the input of an
LNA, and fixturing/cables used in the DUT measurement, and port
2 of the FieldFox
Uncertainty coverage User settable, uncertainty coverage can be set to 1σ (80%)
2σ
Uncertainty bars Displays vertical bars representing the calculated measurement
Before DUT User definable, single value, compensates measurement for
After DUT User definable, single value, compensates measurement for loss
Instrument match VSWR values are preloaded and automatically applied for instrument and U7227A/C/F
or U7228A/C/F preamplifiers
Receiver calibration Uses noise source to calibrate FieldFox receiver gain bandwidth
User calibration with external U7227A/C/F or
Optional calibration performs hot/cold measurement with external preamplifier; applies
receiver and user calibrations
+ U7227/8A (dB)
+ U7227/8C (dB)
N991xD, N993xD
≥ 100 MHz to 2.1 GHz 12.5 5.4
6.4
≥ 2.1 to 2.6 GHz 16.5 5.8
6.9
≥ 2.6 to 4 GHz 13.5 5.4
6.5
≥ 7.5 to 13 GHz
14.5 — 4.7
≥ 25 to 26.5 GHz
22.5 — 6.2
条件:Nominal calculation is based on spectrum analyzer (SA) displayed average noise level (DANL) specification (dBm) stated as
input terminated, RMS detection, log averaging, 0 dB input attenuation, reference level of -20 dBm, normalized to 1 Hz RBW.
≥ 2.0 to 2.1 GHz 12.5
10.1
N991xD, N993xD
≥ 2.1 to 2.6 GHz 16.5
10.4
1 Noise figure (NF) = DANL - (-
173.98 - 2.51) dB
Noise figure (NF) = D - (K - L), where D is the DANL (displayed average noise level) specification, K is kTB (
-173.98 dBm in a
1 Hz bandwidth at 290 K), and L is
2.51 dB (the effect of log averaging used in DANL verifications).
2 U7227/8F maximum frequency is
50 GHz; can be used with N991xB or N993xB up to maximum frequency of 26.5 GHz.
+ U7227/8A (dB)
+ U7227/8C (dB)
N995xD, N996xD
≥ 100 MHz to 2.1 GHz 13.5 5.5
6.5
≥ 2.1 to 2.6 GHz 15.5 5.7
6.7
≥ 2.6 to 4 GHz 15.5 5.6
6.7
≥ 7.5 to 13 GHz
16.5 — 5.0
≥ 25 to 26.5 GHz
21.5 — 5.9
条件:Nominal calculation is based on spectrum analyzer (SA) displayed average noise level (DANL) specification (dBm) stated as
input terminated, RMS detection, log averaging, 0 dB input attenuation, reference level of -20 dBm, normalized to 1 Hz RBW.
+ U7227/8F (dB)
1 Noise figure (NF) = DANL - (-
173.98 - 2.51) dB
Noise figure (NF) = D - (K - L), where D is the DANL (displayed average noise level) specification, K is kTB (
-173.98 dBm in a
1 Hz bandwidth at 290 K), and L is
2.51 dB (the effect of log averaging used in DANL verifications).
适用型号规格 U7227/8A U7227/8C U7227/8F
Frequency 10 MHz to 4 GHz 100 MHz to 26.5 GHz
2 GHz to 50 GHz
Noise figure (dB) 10 MHz to 100 MHz: < 5.5 100 MHz to 4 GHz: < 6 2 to 4 GHz: <
10
4 to 6 GHz: < 5 4 to 40 GHz: <
8
6 to 18 GHz: < 4 40 to 44 GHz: <
9
18 to 26.5 GHz: < 5 44 to 50 GHz: <
10
Gain (dB) 10 to 100 MHz: > 16
100 MHz to 26.5 GHz:
2 GHz to 50 GHz:
> 16.5 + 0.23F 1 100 MHz to 4 GHz: > 0.5F 1 +
17
RF connector 3.5 mm (m) 3.5 mm (m)
2.4 mm (m)
Keysight
346 noise source family
346A 10 MHz to 18 GHz
5 to 7 dB
346B 10 MHz to 18 GHz
14 to 16 dB
346C 10 MHz to 26.5 GHz
12 to 17 dB
346CK40 1 GHz to 40 GHz
3 to 14 dB
346CK01 1 GHz to 50 GHz
7 to 20 dB
Keysight USB smart noise source (SNS) family
U1832A 10 MHz to 18 GHz
4.5 to 6.5 dB
U1832B 10 MHz to 26.5 GHz
4 to 7 dB
U1833A 10 MHz to 18 GHz
14 to 16 dB
U1833B 10 MHz to 26.5 GHz
12 to 17 dB
U1832C 500 MHz to 50 GHz
3.5 to 8.5 dB
U1833C 500 MHz to 50 GHz
10 to 21 dB
U1833D 500 MHz to 60 GHz
6 to 21 dB
Spot Single ENR value (not frequency dependent) (default
15 dB)
Table Applies table of ENR values vs. frequency
Smart (auto) Create, save, recall, edit ENR tables; File type: ENR
T cold Auto (default) or manual
Noise temperature of cold noise standard connected to DUT during the measurement
Connector type SMB (m) DC bias requires accessory N9910X-713 BNC to SMB cable,
for 346 noise sources only
USB
3.0 (Type C) For U183x USB SNS only
Control voltage drive level 28
± 1 V For 346 noise sources only, no need for U183x USB SNS
Operating temperature
0 to 55 ºC
1 F signifies frequency in GHz
Number of points 11 (default), 21, 51, 101, 201, 401, 601, 801
1001
DUT profiles available (built-in GUI wizard aids DUT measurement setup)
Amplifier Includes any non-frequency-converting device
Downconverter Frequency context can be set to RF or IF; sideband can be set to LSB, USB, DSB
Upconverter Frequency context can be set to RF or IF; sideband can be set to LSB, USB, DSB
Multi-stage converter Frequency context can be set to RF or IF
Dual-trace overlay (both traces on one graticule)
Dual-trace split (each trace on separate top and bottom graticules)
显示 data 显示 data, 存储, data 和存储
Trace memory One memory trace per data trace, total of 2 memory traces
Marker table Display
6 markers
Mkr → Peak, Next Peak, Peak Left, Peak Right, Center Frequency, Reference Level,
Data types Trace, Trace+State, Picture (PNG), CSV
条件:The performance listed in these sections below applies to the spectrum analyzer IF output, preamplifier,
interference analyzer and spectrogram, channel scanner and 89600 VSA software capabilities available
FieldFox microwave (combination) analyzers: N9916D, N9917D, N9918D
适用型号 N9950D, N9951D, N9952D, N9953D
FieldFox microwave signal analyzers: N9936D, N9937D, N9938D
Spectrum analyzer mode, zero span, IF output settings
1
Bandwidth options 10 MHz (standard) 40 MHz (Option B04)
120 MHz (Option B10)
Center frequency 33.75 MHz 33.75 MHz
33.75 MHz
IF bandwidth 10 MHz 10 MHz
10 MHz
Center frequency — 225 MHz
225 MHz
IF bandwidth — 100 MHz
100 MHz
Conversion gain
2 Center frequency Narrowband path Wideband path
N991xD, N993xD
< 15 MHz 2 dB to -3 dB
6 dB to 1 dB
≥ 15 MHz to 7.5 GHz 9 dB to -3 dB
15 dB to 1 dB
≥ 7.5 to 20 GHz 8 dB to -5 dB
14 dB to 2 dB
≥ 20 to 26.5 GHz 2 dB to -11 dB
9 dB to -2 dB
N995xD, N996xD
< 15 MHz 8 dB to -8 dB
7 dB to -7 dB
≥ 15 MHz to 7.5 GHz 12 dB to 0 dB
18 dB to 0 dB
≥ 7.5 to 26.5 GHz 12 dB to -2 dB
18 dB to 2 dB
≥ 26.5 to 40 GHz 12 dB to -6 dB
20 dB to -2 dB
≥ 40 to 54 GHz 4 dB to -24 dB
10 dB to -16 dB
条件:SMB male 1 Measurements are uncalibrated in IF output mode 2 RF input to SA output with −20 dBm input power, 0 dB attenuation, and preamp off.
Frequency range Full band (9 kHz to maximum frequency of instrument)
Gain N991xD, N993xD
N995xD, N996xD
Interference Analyzer and Spectrogram (Option
236)
Spectrogram display Overlay, full screen, top, or bottom with active trace
Trace playback and recording • Record all spectrum analyzer measurements
• Playback recorded data using FieldFox
• Frequency mask trigger allows recording to occur upon trigger
• Store data internally or USB or SD card
Channel Scanner (Option
312)
Display Type Bar chart vertical, bar chart horizontal, channel power, strip chart, chart overlay,
Data logging mode Time with geo tagging
Trace playback and recording • Record channel power measurement
• Playback recorded data using FieldFox
• Store data internally or USB or SD card in .csv or .kml format
• Data in .kml format can be exported to Google Earth
89600 VSA Software
条件:The performance listed in this section applies to the OTA analyzer capabilities available in the following
Bandwidth options
10 MHz (standard)
Nominal
40 MHz (Option B04)
120 MHz (Option B10)
N991xD, N993xD
EVM (at center frequency
1 GHz)
LTE-A FDD TM3.1 (10 MHz)
LTE-A FDD TM3.1 (20 MHz)
WCDMA TM4 (5 MHz)
— 0.50%
— 0.65%
— 0.45%
0.45%
0.75%
0.90%
0.45%
0.45%
0.75%
EVM (at center frequency
2.1 GHz)
LTE-A FDD TM3.1 (10 MHz)
LTE-A FDD TM3.1 (20 MHz)
WCDMA TM4 (5 MHz)
0.65%
— 0.80%
0.55%
0.60%
0.85%
0.55%
0.60%
0.85%
EVM (at center frequency
3.5 GHz)
LTE-A FDD TM3.1 (20 MHz) — —
— 0.90%
0.90%
0.90%
EVM (at center frequency
5.8 GHz)
EVM (at center frequency
24 GHz)
N995xD, N996xD
EVM (at center frequency
1 GHz)
LTE-A FDD TM3.1 (10 MHz)
LTE-A FDD TM3.1 (20 MHz)
WCDMA TM4 (5 MHz)
— 0.50%
— 0.60%
— 0.50%
0.50%
0.70%
1.00%
0.50%
0.50%
0.70%
EVM (at center frequency
2.1 GHz)
LTE-A FDD TM3.1 (10 MHz)
LTE-A FDD TM3.1 (20 MHz)
WCDMA TM4 (5 MHz)
0.60%
— 0.85%
0.55%
0.60%
0.90%
0.55%
0.60%
0.90%
EVM (at center frequency
3.5 GHz)
LTE-A FDD TM3.1 (20 MHz) — —
— 0.90%
0.95%
0.90%
EVM (at center frequency
5.8 GHz)
EVM (at center frequency
24 GHz)
EVM (at center frequency
28 GHz)
EVM (at center frequency
39 GHz)
1 Applies when fast channel equalization (default) is OFF
Over-the-Air (OTA) LTE FDD/TDD (Option
370/371)
FieldFox microwave (combination) analyzers: N9916D, N9917D, N9918D
适用型号 N9950D, N9951D, N9952D, N9953D
FieldFox microwave signal analyzers: N9936D, N9937D, N9938D
Series Models OTA analysis frequency range
1
N991xD, N993xD
N9916D, N9936D
1 MHz to 14 GHz
N9917D, N9937D
1 MHz to 18 GHz
N9918D, N9938D
1 MHz to 26.5 GHz
N995xD, N996xD
N9950D, N9960D
1 MHz to 32 GHz
N9950D, N9960D
1 MHz to 44 GHz
N9950D, N9960D
1 MHz to 50 GHz
N9950D, N9960D
1 MHz to 54 GHz
1 Performance specified above
1 MHz . Usable down to 5 kHz .
LTE FDD/TDD Over-the-Air (OTA) measurements
1
User can set up and display 1, 2
3 or 4 simultaneous measurements of key
performance indicators (KPI’s) for any component carrier (CC0 through CC4), up to 5
Cell scan numeric results (for up to 6 cell sites (ID’s)
Vertical power bar graph of selectable cell scan results for up to 6 cell sites with adjustable color “heat” amplitude scale
Spectrum 幅度谱频率 domain (fixed 跨度)
Strip chart Magnitude of selectable cell scan results graphed over
Signal bandwidth Up to 20 MHz
Component carrier CC0 to CC4
通道 table Sets 频率 based 开频段和通道
Favorites list Save up to 6 favorite cellular bands/channels
Window configuration Any combination of 1, 2, 3, or all 4 windows can be displayed simultaneously: 1
2 (top
& bottom)
3 (one top, two bottom), or 4 (quad display)
Data logging Record, recall and playback data for all component carrier(s)
Record settings Meas Interval, Interval type (time or distance), time interval, distance interval
条件:10 MHz frequency reference. When locked to GPS as the frequency reference, this provides accuracy of ±0.01 ppm ( nominal).
The performance listed in this section applies to the OTA analyzer capabilities available in the following
Saving data Save/recall recorded data logs to/from internal memory or external USB or SD card
1 For center frequency signals above 1 GHz, the built -in GPS receiver (Option
307) is highly recommended or locking to any
Over-the-Air (OTA) 5G NR (Option
378)
FieldFox microwave (combination) analyzers: N9916D, N9917D, N9918D
适用型号 N9950D, N9951D, N9952D, N9953D
FieldFox microwave signal analyzers: N9936D, N9937D, N9938D
Series Models OTA analysis frequency range
1
N991xD, N993xD
N9916D, N9936D
1 MHz to 14 GHz
N9917D, N9937D
1 MHz to 18 GHz
N9918D, N9938D
1 MHz to 26.5 GHz
N995xD, N996xD
N9950D, N9960D
1 MHz to 32 GHz
N9951D, N9961D
1 MHz to 44 GHz
N9952D, N9962D
1 MHz to 50 GHz
N9953D, N9963D
1 MHz to 54 GHz
5G NR Over-the-Air (OTA)
PCI (Physical Cell Identifier) (C-S-G) (Cell ID-Sector ID-Group ID)
SSB Index (Synchronization Signal Block Index)
SS-RSRP (Synchronization Signal Reference Signal Received Power) (dBm)
SS-RSRQ (Synchronization Signal Reference Signal Received Quality) (dB)
RSSI (Received Signal Strength Indicator) (dBm)
SS-SINR (Synchronization Signal Signal-to-Noise and Interference Ratio) (dB)
SSS (Secondary Synchronization Signal) (dBm)
条件:Freq Err (Frequency Error) (Hz) 1 Performance specified above 1 MHz . Usable down to 5 kHz . 2 For center frequency signals above 1 GHz, the built -in GPS receiver (Option 307) is highly recommended or locking to any 10 MHz frequency reference. When locked to GPS as the frequency reference, this provides accuracy of ± 0.01 ppm ( nominal).
PBCH DMRS (Physical Broadcast Channel Demodulation Reference Signal) (dBm)
5G NR EVM conducted
SSB Case (Synchronization Signal Block Case)
SSB Lmax (Maximum Number SSB’s within SSB Set, Lmax = 4
8 or 64)
SSB RB Offset (Synchronization Signal Block Resource Block Offset)
SSB SC Offset (Synchronization Signal Block Subcarrier Offset)
SSB Delta Center (Synchronization Signal Block Delta Center) (kHz)
PBCH EVM (Physical Broadcast Channel EVM) (%rms)
PBCH DMRS EVM (Physical Broadcast Channel Demodulation Reference Signal EVM)
SS-RSRP (Synchronization Signal Reference Signal Received Power) (dBm)
SS-RSRQ (Synchronization Signal Reference Signal Received Quality) (dB)
PBCH 功率 (物理 Broadcast 通道功率) (dBm)
PCBCH DMRS Power (Physical Broadcast Channel Demodulation Reference Signal
Signal bandwidth Up to 100 MHz (Requires Option B10)
Component carrier CC0 to CC7 (5G NR Over-the-Air (OTA) measurements)
CC0 to CC4 (5G NR conducted EVM measurements)
条件:indicators (KPI’s) for any component carrier, in any combination of the following 1:
User can set up and display 1, 2
3 or 4 simultaneous measurements of key performance
Table Cell scan numeric results (for up to 6 cell sites (ID’s)
Bar chart Vertical power bar graph of selectable cell scan results for up to 6 cell
Spectrum 幅度谱频率 domain (fixed 跨度)
Strip chart Magnitude of selectable cell scan results graphed over time
Window configuration Any combination of 1, 2, 3, or all 4 windows can be displayed simultaneously: 1
2 (top &
bottom)
3 (one top, two bottom), or 4 (quad display)
1 You can also display the results from multiple component carriers on the table, bar chart, and strip chart displays.
Setup parameters
5G NR Over-the-Air (OTA)
Frequency error threshold 0 Hz to 7.5 kHz
1
Subcarrier spacing 15 kHz, 30 kHz, 120 kHz
240 kHz
SSB case Auto, A, B, C, D, E
Capture length 4, 8, 16, 24
32 or 40 frames
EMF Units dBµV/m, V/m
5G NR Conducted EVM
FR1: 5, 10, 15, 20, 25, 30, 40, 50, 60, 70, 80, 90
100 MHz
Subcarrier spacing 15 kHz, 30 kHz, 120 kHz
240 kHz
Export results Exports SSB center frequency, SSB subcarrier spacing, SSB Case and SSB Lmax
to 5G NR OTA setup
Data logging Record, recall and playback data for all component carrier(s)
Record settings Meas Interval, Interval type (time or distance), time interval, distance interval
条件:The performance listed in this section applies to the indoor and outdoor mapping capabilities available in
Saving data Save/recall recorded data logs to/from internal memory or external USB or SD card
1 The frequency error threshold is dependent on the SCS - freq err threshold = +/
-1/4 * SCS (e.g. for 15 kHz, freq err threshold =
3.75 kHz).
Indoor and Outdoor Mapping (Option
352)
FieldFox microwave (combination) analyzers: N9916D, N9917D, N9918D
适用型号 N9950D, N9951D, N9952D, N9953D
FieldFox microwave signal analyzers: N9936D, N9937D, N9938D
条件:level and the mapping capability can be enabled within the following modes:
Option 352 adds indoor and outdoor mapping capability to FieldFox analyzers, so that FieldFox can
import maps from OpenStreetMap (OSM) for data collection and data plotting to the map directly on the
FieldFox instrument display. The FieldFox indoor and outdoor mapping feature resides at the System
• Channel Scanner (Option
312)
• Phased Array Antenna Support (Option
360)
• Over-the-Air (OTA) LTE FDD/TDD (Option
370/371)
• Over-the-Air (OTA) 5G NR (Option
378)
• Indoor and outdoor mapping (Option
352) requirements:
• Spectrum analyzer mode (Option
233 on N991xD/N995xD, default mode on N993xD/N996xD)
• GPS receiver (Option
307), required for outdoor mapping
• OSM maps can be saved to the FieldFox internal memory, SD card or USB drive. This can be done
via a direct wired LAN connection or OSM maps can be downloaded and saved to FieldFox using the
Map coordinates Latitude, longitude
条件:Support Tool, OSM map files can be downloaded to a .zip file and imported to FieldFox internal memory.
Using a direct wired LAN connection, FieldFox will automatically access OSM once location coordinates
(latitude and longitude) and zoom levels are entered the Map Explorer menu. If using the FieldFox Map
If the FieldFox GPS receiver is enabled and OSM maps have been previously saved to FieldFox with
those GPS coordinates, FieldFox can automatically load the corresponding map to match the GPS
EMF Measurements (Option
358)
AGOS Advanced Technologies, Triaxial Isotropic Antenna
Model: SDIA-6000 (or
85572A-006 if ordered directly from Keysight)
Frequency coverage
30 MHz to 6 GHz
Supported operating modes Spectrum analyzer (Channel Power measurement only)
Over-the-Air (OTA): LTE FDD, LTE TDD
5G NR
Spectrum analyzer mode: dBuV/m, dBm/m2, V/m, Watt/cm2, W/m2, dBµA/m,
Over-the-Air (OTA) LTE FDD, LTE TDD
5G NR mode: V/m, dBµV/m
Measurement time Sweep time acquisition control can be set from 1 to 5000
支持的文件类型 Spectrum 分析仪模式: CSV
条件:The performance listed in this section applies to the AM/FM analog demodulation, tune and listen
Over-the-Air (OTA) LTE FDD, LTE TDD
5G NR mode: CSV, KML
Saving data Save/recall recorded data logs to/from internal memory or external USB or SD card
AM/FM Analog demodulation, Tune and Listen (Option
355)
FieldFox microwave (combination) analyzers: N9916D, N9917D, N9918D
适用型号 N9950D, N9951D, N9952D, N9953D
FieldFox microwave signal analyzers: N9936D, N9937D, N9938D
Display type RF spectrum view, demodulated waveform, including peak+ and peak- traces
Audio demodulation type AM, FM narrow, FM wide, SSB and CW (Morse code), listen to the tones using
FieldFox’s built-in speaker or headphones
Measurement type RF carrier power (dBm), RF carrier frequency (Hz), modulation rate (Hz), SINAD
Maximum modulation rate 5 kHz, demod sweep time
50 µs to 50 ms
Depth (peak-to-peak/2) (%), ± peak depth (%)
Depth range Modulation
0.1% to 99%
Maximum modulation rate 5 kHz, demod sweep time
50 µs to 50 ms
Record audio into WAV file with time stamp and geo tag and playback on PC
With a radio standard applied, pre-defined frequency bands, channel numbers or uplink / downlink
selections can be used instead of manual frequency entry. The pre-defined FieldFox radio standards
include bands such as W-CDMA, LTE, and GSM. Alternately, users can create custom standards and
import them into FieldFox analyzers
条件:With time gating, you can measure the spectrum of a periodic signal during a specified time interval.
Pulsed-RF signals are an example of a periodic signal that can be measured with time gating. For
components that would otherwise be hidden. FieldFox’s time gating method is a Gated FFT.
Spectrum Analyzer Time Gating (Option
238)
example, you can measure the pulse during the on period, not the transition or the off period. Or you can
exclude interfering signals such as a periodic transient. Time gating allows you to view spectral
RBW range
1 Hz to 300 kHz (derived from gate width)
Gate delay range
-150 ms to 10 s
Gate width (length) range
6 μs to 1.8 s
Gate sources External, RF burst, Video
条件:ERTA specifications apply to the following FieldFox models. The RF & microwave analyzers must be
Extended Range Transmission Analysis (ERTA) (Option
209)
FieldFox microwave (combination) analyzers: N9916D, N9917D, N9918D
适用型号 N9950D, N9951D, N9952D, N9953D
FieldFox microwave signal analyzers: N9936D, N9937D, N9938D
适用型号 N9960D, N9961D, N9962D, N9963D
条件:accessories. See FieldFox Configuration Guide for option information. Many capabilities listed in this Data
ERTA operation requires two FieldFox units, each one configured with specific options, and certain
条件:InstAlign technique, ERTA can be used to make accurate gain or loss measurements.
ERTA can be used to measure the scalar transmission gain or loss of an RF system. It is useful when
measuring long lossy cables where the two ends cannot easily be brought together, such as those bolted
in on ships or aircrafts. It is also useful in measuring the insertion loss of waveguide systems, or using the
frequency-offset feature, devices such as mixers and converters.
ERTA measurements are based on two FieldFox units; one at each end of the measured DUT. One
FieldFox is the source and reference receiver (R), while the other is the measurement receiver (B). The
two FieldFox units are synchronized using hardware triggering. By taking advantage of FieldFox’s
以上指标摘自厂家官方数据手册,完整定义、测试条件与保证值口径以手册为准。完整指标、测试条件与定义口径请见产品页「软件和手册 | 白皮书」栏目中的官方数据手册。
是德科技 | KEYSIGHT · onetest 仪器资源库



 客服





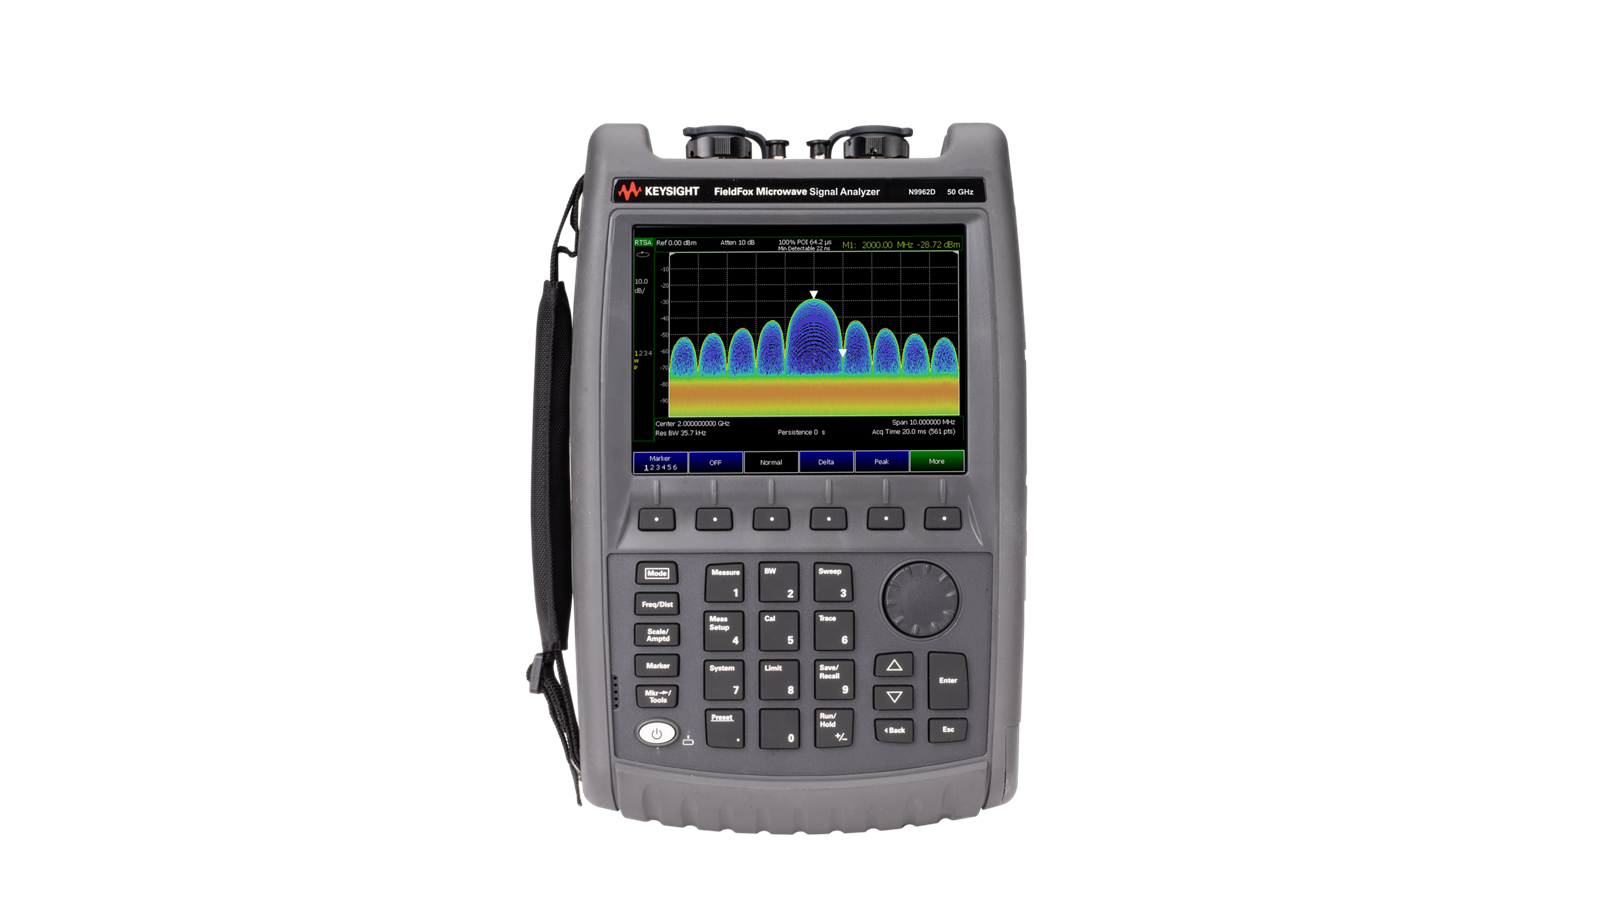
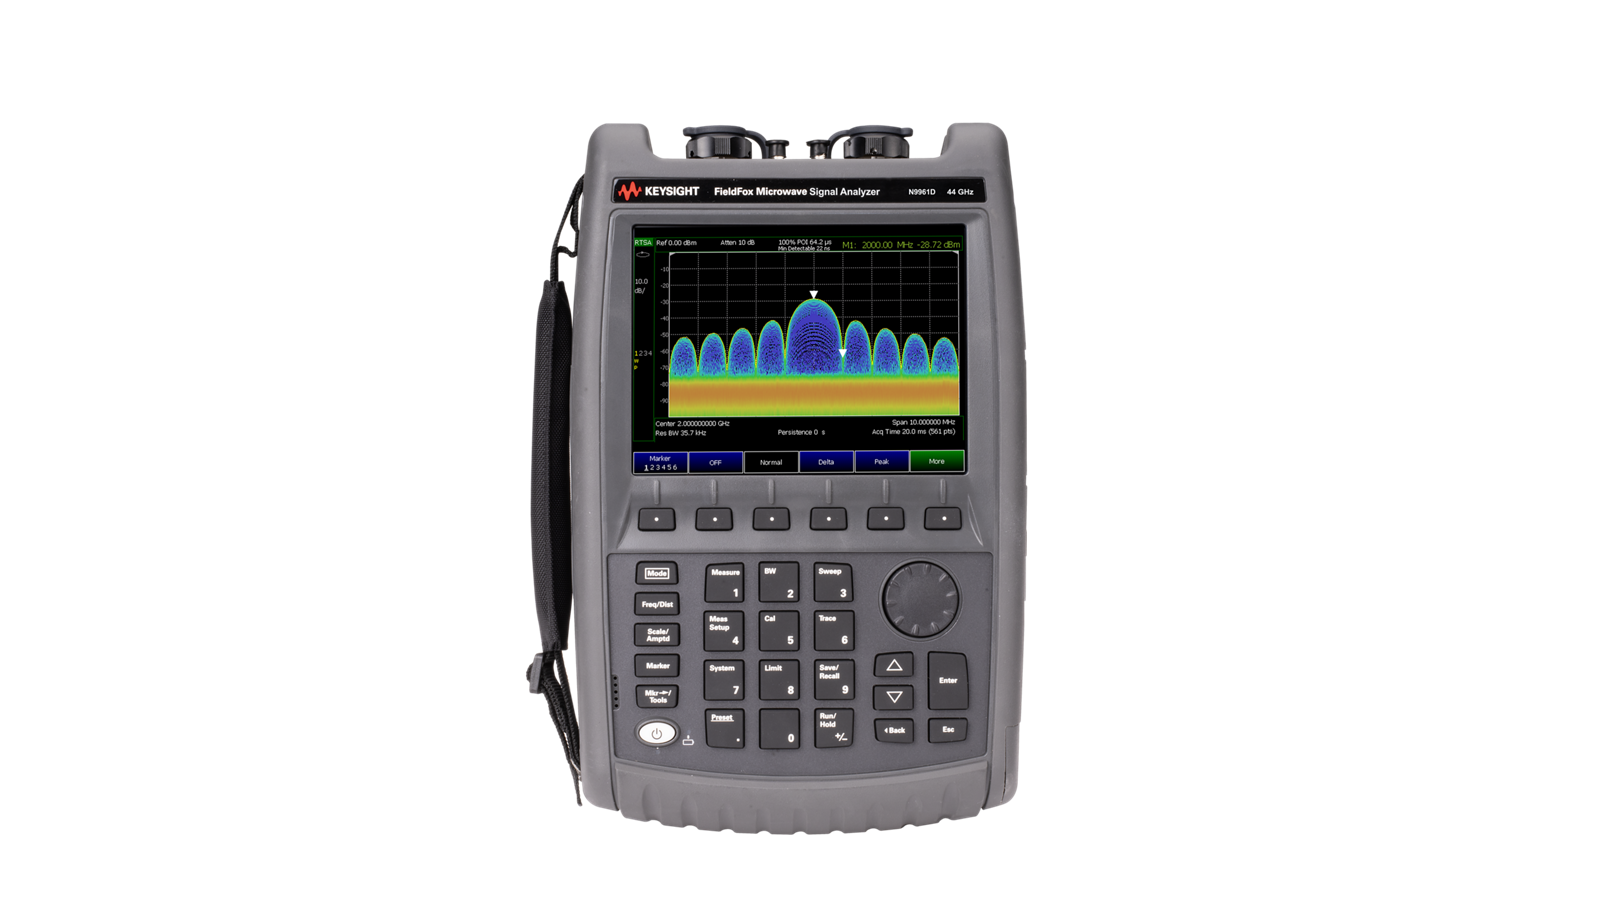





 粤公网安备44030902003758