是德科技|KEYSIGHT
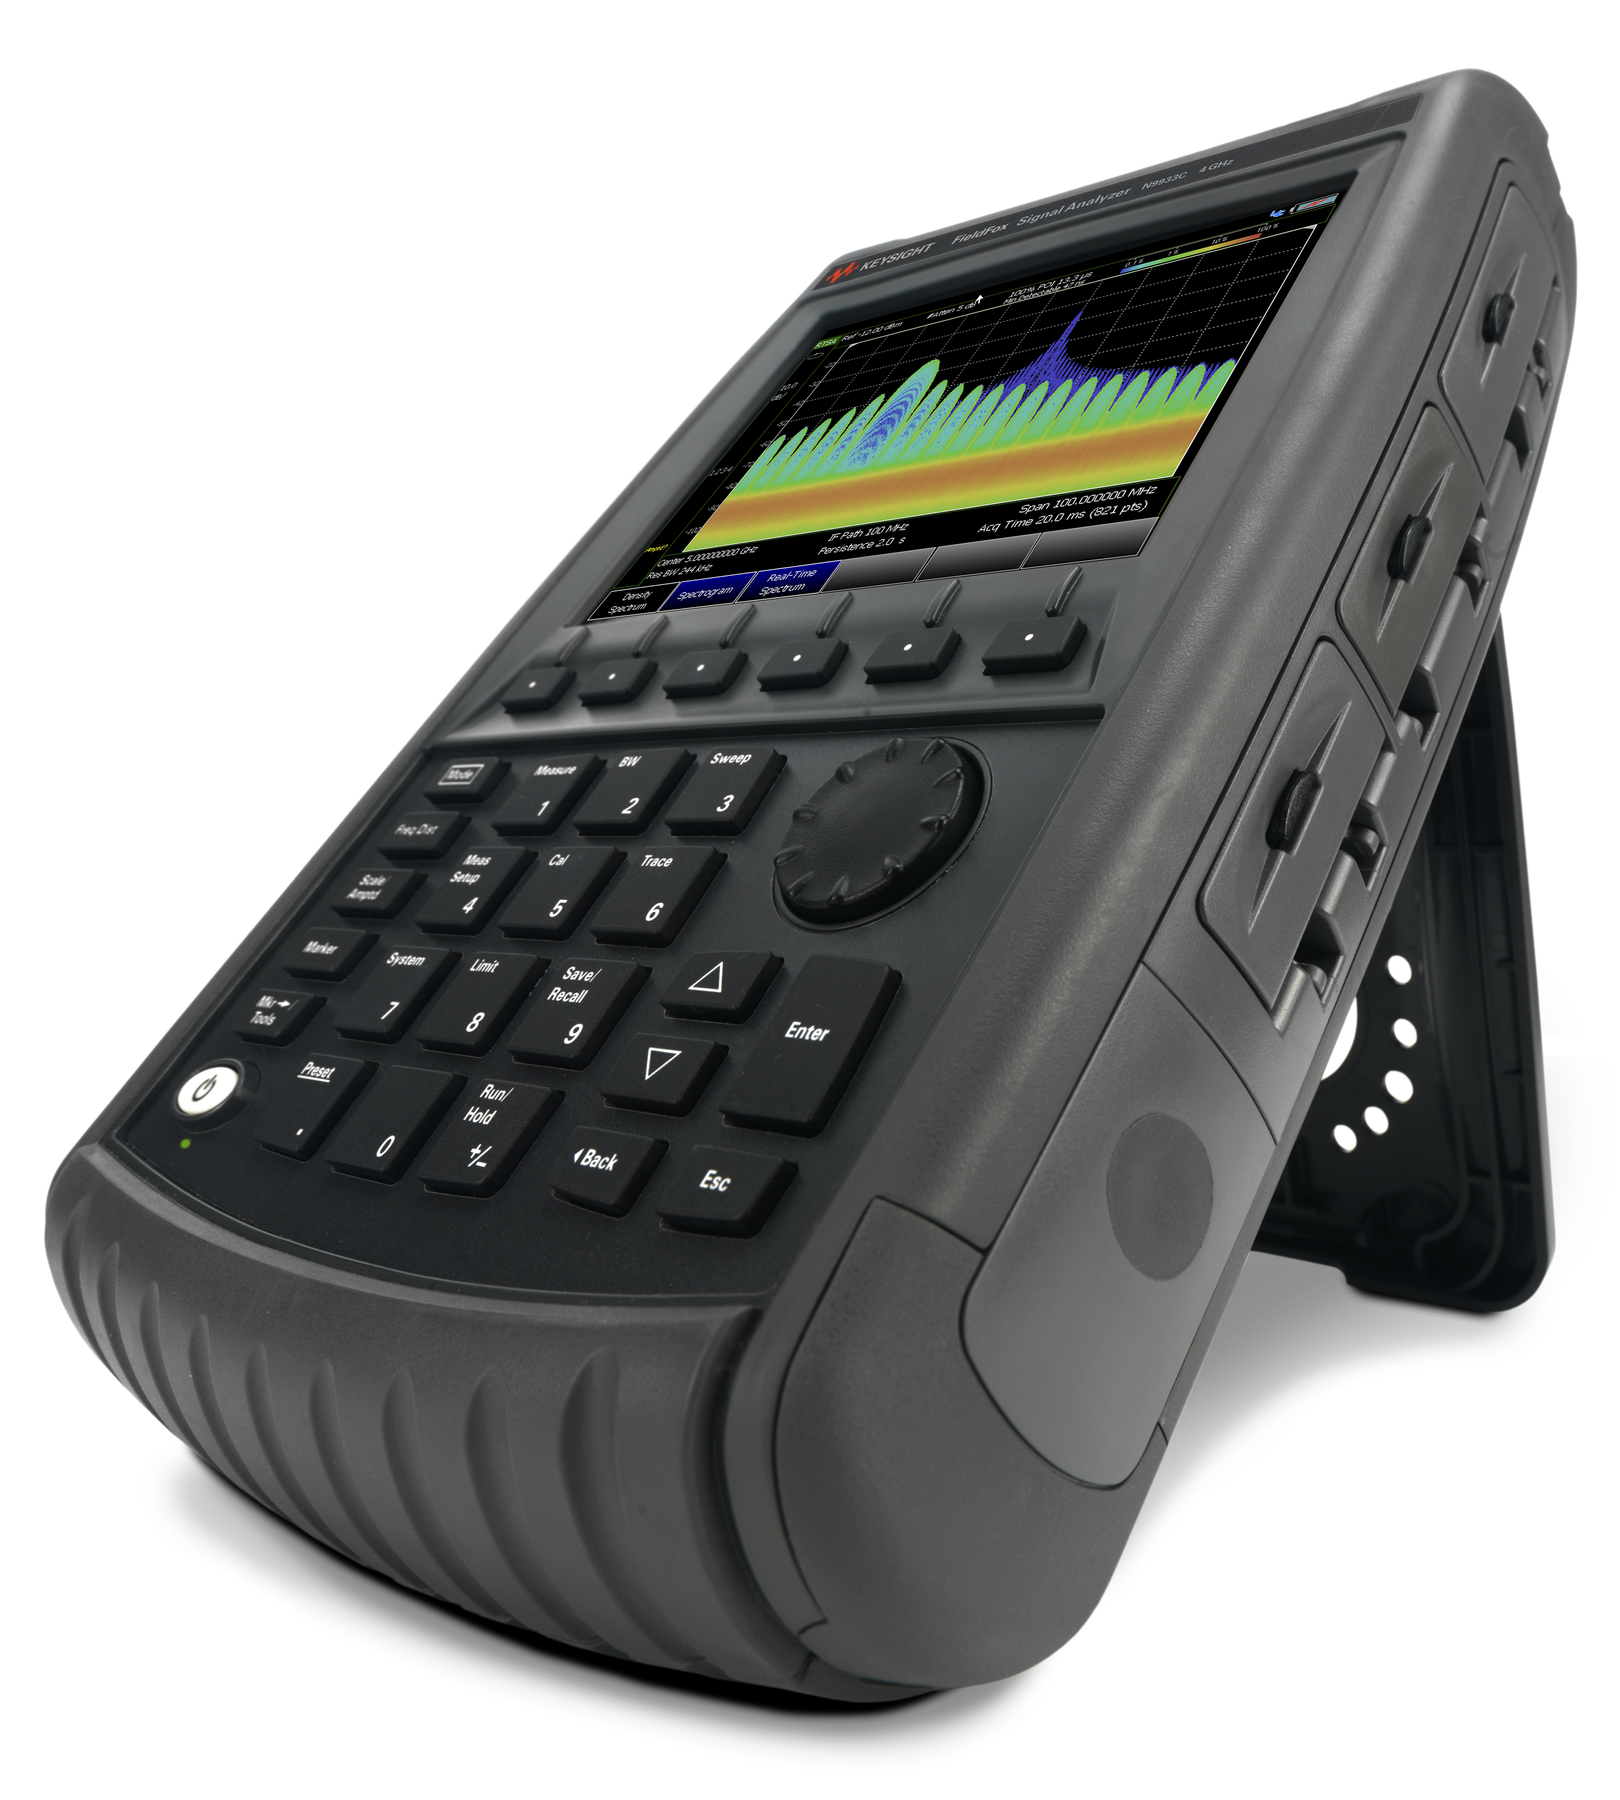
FieldFox-级手持式信号分析仪,4 GHz 详细指标
将精准测量带入现场
详细指标
本页为厂家公布指标的**原文摘录**(英文数据手册直排,未做折算);标注 spec./typ./char./nom. 者为原文口径词,含义见数据手册 Definition 一节。
Frequency Specifications
• Models Frequency range:
• N991xC N9912C 3 kHz to 4/6.5/10 GHz:
• N9913C 3 kHz to 4 GHz:
• N9914C 3 kHz to 6.5 GHz:
• N9915C 3 kHz to 10 GHz:
• Frequency reference, -10 to 55 °C:
• Accuracy ± 0.9 ppm (spec) + aging:
• ± 0.5 ppm (typical) + aging:
• Accuracy, when locked to GPS ± 0.010 ppm (nominal):
• Accuracy, when GPS antenna is disconnected ± 0.4 ppm (nominal)1:
• Aging Rate ± 1 ppm/yr for 20 years (spec), will not exceed ± 3.5 ppm:
Frequency resolution Specifications
• 3 kHz to 1.49961 GHz 0.34 Hz:
• > 1.49961 to 2.99961 GHz 0.67 Hz:
• > 2.99961 GHz to 5.99961 GHz 1.34 Hz:
• > 5.99961 GHz to 10 GHz 2.68 Hz:
• Data points or resolution:
• 101, 201, 401, 601, 801, 1001, 1601, 4001, 10,001:
• Arbitrary number of points settable through front panel and SCPI:
• IF bandwidth2:
• 3 Hz, 10 Hz, 30 Hz, 100 Hz, 300 Hz, 1 kHz, 3 kHz, 10 kHz, 30 kHz, 100 kHz:
• System impedance:
• 50 Ω (nominal), 75 Ω with appropriate adapter and calibration kit:
• 1 The maximum drift expected in the frequency reference applicable when the ambient temperature changes ±5°C from the:
• temperature when the GPS signal was last connected.:
• 2 VNA mode only. Recommend using averaging in CAT mode.:
Test port output Specifications
• High power in the N991xC refers to the analyzer’s target output power level when the Power Setting is:
• High. An example::
• • N991xC: For a 58.4 MHz to 10 GHz frequency sweep, the analyzer achieves an 8 dBm power level:
• across the band.:
• Low power level for N991xC analyzers flattens at -50 dBm across the entire frequency band and is the:
• analyzer’s output when the Power Setting is Low.:
• Max leveled power in the N991xC refers to the maximum leveled (flattened) power achieved across the:
• designated frequency range. An example::
• • N991xC: For a 58.4 MHz to 10 GHz frequency sweep with the analyzer configured to measure all four:
• S-parameters, needing both ports 1 and 2, the maximum power the analyzer can be set to is:
• 7 dBm.:
• Test port output power (dBm), high power Typical:
• N991xC Port 1 or Port 2:
• 3 kHz to 50 kHz -12:
• > 50 kHz to 150 kHz -6:
• > 150 kHz to 300 kHz -2:
• > 300 kHz to 800 kHz 0:
• > 800 kHz to 3.45 MHz 2:
• > 3.45 MHz to 58.4 MHz 5:
• > 58.4 MHz to 10 GHz 8:
• Test port output power (dBm), low power Typical:
• N991xC Port 1 or Port 2:
• 3 kHz to 10 GHz -50 dBm (flattened) ±0.5 dB:
• Max leveled output power (dBm) Nominal Nominal:
• N991xC Port 1 Port 2:
• > 3.45 MHz to 58.4 MHz 5 5:
• > 58.4 MHz to 10 GHz 8 7:
• Output power range:
• CAT High, low, and manual. Default (preset) power is manual, −15 dBm.:
• Manual power is flattened.:
• VNA High, low, and manual. Default (preset) power is manual, −15 dBm.:
• Manual power is flattened.:
• Power step size:
• Power settable in 1 dB steps across power range. Flat power, in 1 dB steps, is available across the whole:
• frequency span, nominal.:
• Power level accuracy1 Typical:
• N991xC Port 1 or Port 2 at -20 dBm:
• 3 kHz to 300 kHz ± 0.6 dB:
• > 300 kHz to 10 GHz ± 0.5 dB:
• Power level linearity Nominal:
• N991xC Port 1 or Port 2, −50 dBm ≤ P < max leveled power:
• > 10 MHz to 10 GHz ± 0.45 dB:
System performance Specifications
• 3 kHz to 30 kHz - 86 - 87:
• > 30 kHz to 1 MHz - 110 - 115:
• > 1 MHz to 10 MHz 102 117 101 116:
• > 10 MHz to 4 GHz 106 118 103 118:
• > 4 GHz to 6.5 GHz 104 117 104 120:
• > 6.5 GHz to 10 GHz 104 116 102 117:
• Measurement stability over temperature Nominal Nominal:
• N991xC Frequency Magnitude (dB/ºC) Phase (deg/ºC):
• 3 kHz to 100 kHz ± 0.6 ± 2.9:
• > 100 kHz to 10 GHz ± 0.011 ± 0.4:
• Measurement speed (Sweep time):
• CAT N991xC:
• Return loss, 3 kHz to 10 GHz, 1-port cal, 1001 points 461 µs/pt:
• Distance-to-fault, 100-meter cable, 1-port cal, 1001 points 512 µs/pt:
• VNA N991xC:
• S11 and S21, 30 kHz to 10 GHz, enhanced response cal, 100 kHz:
• IF bandwidth, 1001 points:
• 200 μs/pt:
• 1 Power levels are calibrated based on PNA-X tuned receiver for the entire frequency range.:
• 2 System dynamic range is measured in the factory with loads on the test ports after a thru normalization.:
• 3 For CAT mode, “Insertion loss (2- port)”, decrease listed dynamic range specifications by 20 dB, as CAT mode IFBW is fixed at:
• 10 kHz. Can obtain full dynamic range by using S21 measurement in VNA mode with 100 Hz IFBW.:
• System dynamic range2,3 (dB), high power, 300 Hz IFBW, 100-point average, Port 1 or Port 2 (-10 to 55°C):
• Frequency S12 Spec S12 Typical S21 Spec S21 Typical:
• Trace noise, high power, 300 Hz IFBW, Port 1 or Port 2 Specifications (-10 to 55⁰C):
• N991xC Frequency Magnitude (dB rms) Phase (deg rms):
• 3 kHz to 50 kHz 0.00521 0.0721:
• > 50 kHz to 5 GHz2 0.0011 0.011:
• > 5 GHz to 10 GHz 0.0015 0.015:
• Receiver compression Typical:
• N991xC Frequency Port 1 or Port 2:
• 250 kHz to 1.25 GHz +8 dBm, 0.20 dB compression:
• > 1.25 GHz to 5 GHz +8 dBm, 0.15 dB compression:
• > 5 GHz to 10 GHz +8 dBm, 0.10 dB compression:
• Maximum input level Port 1 or Port 2:
• N991xC Average CW power DC:
• +25 dBm, 0.3 watts ±40 VDC:
• Immunity to interfering signals:
• N991xC Nominal:
• On carrier frequency +7 dBm:
• Offset from carrier frequency > 1 MHz +7 dBm:
• > 10 MHz +10 dBm:
• 1 Typical values, 10 Hz IFBW.:
• 2 Excludes frequency range between 5 MHz and 25 MHz.:
• CAT and VNA measurements:
• CAT mode:
• CAT measurements Distance-to-fault (dB), Distance-to-fault (Lin):
• Return loss (dB):
• Return loss & DTF (dB):
• VSWR:
• Distance-to-fault (VSWR):
• Cable loss (1-port):
• Insertion loss (2-port) (requires option 211):
• TDR (Lin rho) (requires option 215), TDR (ohm) (requires option 215):
• TDR & DTF (requires option 215):
• Distance-to-Fault (DTF) settings:
• Frequency/distance:
• Sweep time:
• Frequency mode:
• Start distance, stop distance:
• Units: meters or feet (Can also be set as Preferences):
• Bandpass, lowpass:
• CAT mode averaging Set sweep time in seconds:
• Distance-to-fault Available in CAT mode. Standard on N991xC analyzers.:
• Range = velocity factor x speed of light x (# of points -1) / freq. span x 2;:
• # of points auto coupled according to start and stop distance entered.:
• Resolution = range / (# of points -1):
• Transform modes: Bandpass, low-pass:
• Window types: Maximum, medium, and minimum:
• Alias free range indicator: On/Off:
• Dispersion compensation for waveguide: Yes:
• Return loss, log magnitude -500 to 500 dB:
• Log magnitude resolution 0.01 dB:
• VSWR 1.01 to 1000:
• VSWR resolution 0.01:
• VNA mode:
• VNA Transmission/Reflection (T/R) S11, S21 magnitude and phase (requires option 210):
• VNA S-parameters S11, S21, S22, S12 magnitude and phase:
• (N9912C requires option NAx, other N991xC requires options 210 and:
• 211):
• Number of traces Four traces available: Tr1, Tr2, Tr3, Tr4:
• Display formats Single-trace:
• Dual-trace split (each trace on separate graticule):
• Dual-trace overlay (both traces on one graticule):
• Three-trace split (each trace on separate graticule):
• Three-trace overlay (all three traces on one graticule):
• Quad-trace split (each trace on separate graticule):
• Quad-trace overlay (all four traces on one graticule):
• VNA trace formats Log magnitude, linear magnitude, VSWR, phase, Smith chart, polar,:
• group delay, unwrapped phase, real impedance, imaginary impedance,:
• Z magnitude:
• Frequency settings Start, stop, center, span:
• Frequency sweep type Linear:
• Sweep type trigger Continuous, single:
• Sweep trigger source Internal, external, point (point trigger applies to 1-port cal only):
• Sweep trigger slope Positive, negative:
• Sweep trigger delay 0 to 10 seconds:
• Averaging Sweep: 2 to 1000; Point: 2 to 500:
• Smoothing Computes the moving average of adjacent data points. Smoothing:
• aperture defines the trace width (number of points) to be averaged.:
• Minimum aperture: 0.05% of frequency span:
• Maximum aperture: 25% of frequency span:
• Scale Autoscale, scale, reference level, reference position:
• Autoscale: Automatically selects scale resolution and reference value to:
• center the trace.:
• Autoscale all: Scales all visible traces.:
• S11, log magnitude -500 to 500 dB:
• Log magnitude resolution 0.01 dB:
• VSWR 1.01 to 1000:
• VSWR resolution 0.01:
• Phase -180 to +180 degrees (unwrapped phase can show larger values):
• Phase resolution 0.01 degrees:
• Phase offset -360 to +360 degrees:
• Magnitude offset -100 to +100 dB:
• Trace math Vector division or subtraction of current linear measurement values and:
• memory data:
• Port extension For both port 1 and port 2, delay settings. Port extensions apply to all:
• measurements.:
• Marker formats Default marker format is the trace format. Other formats::
• R + jX; Z magnitude; Phase; Real; Imaginary:
• Mag & Phase:
• dB Angle:
• General CAT / VNA modes:
• Marker functions Peak, Next Peak, Peak Left, Peak Right, Mkr→Center, Mkr→Delay, Min:
• Search, Peak Excursion, Peak Threshold, Target, Bandwidth (BW, Q,:
• Loss), Tracking CAT mode only: Tracking 3 peaks (CAT mode),:
• Marker→Start distance, Marker→Stop distance:
• Marker table On/Off:
• Marker types Normal, delta, data trace and memory trace markers:
• Marker coupling On/Off (coupling between traces):
• Frequency blanking Security level: none, high. If high, all frequency information is blanked:
• out. An instrument preset is required to re-enable the frequency:
• information.:
• Display data Display data, memory, data and memory, or data math:
• Trace math One memory trace per data trace.:
• CAT and VNA mode calibrations:
• FieldFox analyzers offer three tiers of calibrations, thus providing users with different levels of calibration:
• effort and accuracy.:
• CalReady:
• CalReady is the most basic calibration and is sufficient for a quick pass/fail or go/no go verification. Every:
• FieldFox is calibrated at the factory, at test ports 1 and 2, at room temperature. CalReady can be applied:
• either as an “enhanced response CalReady” or a “2-port CalReady.” The default setting is 2-port:
• CalReady, so correction is applied to both ports. A user preference allows user to change the CalReady:
• methodology to enhanced response CalReady.:
• A 30-minute warm-up period is recommended for a quick test. A 60-minute warm-up is necessary for:
• more stringent test requirements.:
• If CalReady is the basis for most measurements, the annual cal cycle must be followed, as the CalReady:
• calibration will be updated during the annual cal cycle.:
• Standard calibrations:
• Standard calibrations are the most accurate calibrations offered in FieldFox. FieldFox’s calibration engine:
• is based on Keysight’s flagship PNA calibration engine, and as such, offers many of the standard:
• calibrations. FieldFox supports both coaxial and waveguide calibrations. The table below lists the:
• commonly used calibrations.:
• Keysight recommends a 30-minute warm-up period for standard calibrations. For ultimate in stability and:
• accuracy, a 90-minute warm-up period is necessary.:
• Frequency response:
• Open response:
• Short response:
• Thru response:
• With and without isolation:
• Simultaneous magnitude and phase correction of frequency response errors:
• for either reflection or transmission measurements. Isolation corrects for:
• crosstalk errors.:
• 1-port OSL (Port 1):
• 1-port OSL (Port 2):
• SSL (for waveguide):
• Open, short, and load:
• Traditional 1-port calibration for reflection measurements. Corrects for:
• directivity, source match, and frequency response errors.:
• For waveguide calibrations, depending on the calibration kit definition, this is:
• presented as a short, offset short and load calibration.:
• Enhanced response (also known:
• as one-path, two-port):
• Forward enhanced response:
• Reverse enhanced response:
• Corrects for frequency response and source match. Partial correction for load:
• match for low-loss reciprocal devices.:
• QSOLT (2-port) QSOLT or Quick short-open-load-thru is FieldFox’s default recommended:
• calibration for insertable devices. Full 12-term error correction. Requires fewer:
• connections, compared to traditional SOLT (4 compared to 7). Corrects for:
• directivity, source match, reflection frequency response, load match, and:
• transmission frequency response.:
• Full 2-port (unknown thru:
• calibration):
• FieldFox’s default recommended calibration for non-insertable devices. Full 12-:
• term error correction. Beneficial for characterizing non-insertable devices such:
• as Type-N to 3.5 mm, or female-female devices. Corrects for directivity, source:
• match, reflection frequency response, load match, and transmission frequency:
• response.:
• TRL TRL or thru-reflect-line compensates for directivity, reflection, and transmission:
• frequency response in both the forward and reverse directions.:
• ** Note: FieldFox does not offer the traditional SOLT calibration. Instead, it offers the more accurate Full 2- port (unknown thru),:
• and also QSOLT.:
• ECal:
• FieldFox supports all Keysight USB ECal modules, both standard and value-line ECals.:
• FieldFox’s guided calibration wizard:
• FieldFox’s calibration wizard recommends a calibration type and calibration kit based on selected:
• parameters and connector types. Alternatively, users can select their own calibration type and calibration:
• kit. FieldFox’s calibration wizard ensures a valid calibration selection.:
• Interpolation error correction:
• With any type of accuracy enhancement applied, interpolated mode recalculates the error coefficients:
• when the test frequencies are changed. The number of points can be increased or decreased, and the:
• start/stop frequencies can be changed, but the resulting frequency span must be a subset of the original:
• calibration frequency span.:
• Connectors:
• The FieldFox firmware supports the following connector types by default. Add other connector types with:
• a calibration kit that contains the connector type.:
• Coaxial Waveguide:
• Type-N 50 ohm WR-10 WR-90:
• Type-N 75 ohm WR-15 WR-112:
• 7/16 WR-19 WR-137:
• TNC WR-22 WR-159:
• Type-F WR-28 WR-187:
• 7 mm WR-34 WR-229:
• 3.5 mm WR-42 WR-284:
• 2.92 mm WR-51 WR-650:
• 2.4 mm WR-62:
• 1.85 mm WR-75:
• FieldFox S-parameter measurement uncertainties:
• The configurations listed below include measurement uncertainties based on ISO GUM methodology:
• calculations.:
• FieldFox model Calibration kit Calibration type DUT connector Uncertainty:
• N991xC 85518A or 85519A Full 2-port calibration Type-N Spec:
• N991xC 85054D Full 2-port calibration Type-N Spec:
• N991xC N7554A Full 2-port calibration Type-N Spec:
• N991xC N4690D Full 2-port calibration Type-N Spec:
• Corrected Measurement Uncertainty:
• N9912/13/14/15C, 85518A or 85519A, Full 2-port Cal, DUT: Type-N, Spec:
• Corrected performance table calculated using uncertainties with a coverage factor of 2.:
• Corrected:
• performance (dB) 0.003 to 500 MHz 0.5 to 2 GHz 2 to 8 GHz 8 to 10 GHz:
• Directivity 40 41 34 32:
• Source match 38 34 30 29:
• Load match1 39 36 28 28:
• Reflection tracking ±00011 ±0.02 ±0.036 ±0.009:
• Transmission tracking1 ±0.044 ±0.087 ±0.21 ±0.21:
• Uncertainty plots: power level of -20 dBm, 10 Hz IF bandwidth, no averaging, battery saver off, and 60-:
• minute warm-up time. Includes uncertainties due to drift, noise, compression, and dynamic accuracy.:
• Coverage factor of 1 applied to uncertainties, for ease of comparison with other industry handheld:
• analyzers.:
• Transmission uncertainty (S21, S12):
• Reflection uncertainty (S11, S22):
• 1. Load match and transmission tracking are typical values.:
• N9912/13/14/15C, 85054D, Full 2-port Cal, DUT: Type-N, Spec:
• Corrected performance table calculated using uncertainties with a coverage factor of 2.:
• Corrected performance (dB) 0.003 to 500 MHz 0.5 to 2 GHz 2 to 8 GHz 8 to 10 GHz:
• Directivity 37 37 33 31:
• Source match 37 37 33 31:
• Load match1 37 37 33 31:
• Reflection tracking ±0.00068 ±0.0019 ±0.0053 ±0.0073:
• Transmission tracking1 ±0.004 ±0.012 ±0.038 ±0.042:
• Uncertainty plots: power level of -20 dBm, 10 Hz IF bandwidth, no averaging, battery saver off, and 60-:
• minute warm-up time. Includes uncertainties due to drift, noise, compression, and dynamic accuracy.:
• Coverage factor of 1 applied to uncertainties, for ease of comparison with other industry handheld:
• analyzers.:
• Transmission uncertainty (S21, S12):
• Reflection uncertainty (S11, S22):
• 1 Load match and transmission tracking are typical values.:
• N9912/13/14/15C, N7554A ECal, Full 2-port Cal, DUT: Type-N, Spec:
• Corrected performance table calculated using uncertainties with a coverage factor of 2.:
• Corrected performance (dB) 0.003 to 500 MHz 0.5 to 2 GHz 2 to 8 GHz 8 to 10 GHz:
• Directivity 44 44 42 40:
• Source match 36 32 28 28:
• Load match1 36 34 28 27:
• Reflection tracking ±0.0067 ±0.0036 ±0.054 ±0.076:
• Transmission tracking1 ±0.063 ±0.086 ±0.14 ±0.16:
• Uncertainty plots: power level of -20 dBm, 10 Hz IF bandwidth, no averaging, battery saver off, and 60-:
• minute warm-up time. Includes uncertainties due to drift, noise, compression, and dynamic accuracy.:
• Coverage factor of 1 applied to uncertainties, for ease of comparison with other industry handheld:
• analyzers.:
• Transmission uncertainty (S21, S12):
• Reflection uncertainty (S11, S22):
• 1 Load match and transmission tracking are typical values.:
• N9912/13/14/15C, N4690D ECal Option 0DC, Full 2-port Cal, DUT: Type-N, Spec:
• Corrected performance table calculated using uncertainties with a coverage factor of 2.:
• Corrected performance (dB) 1 0.003 to 500 MHz 0.5 to 2 GHz 2 to 8 GHz 8 to 10 GHz:
• Directivity 45 45 40 40:
• Source match 40 43 40 40:
• Load match2 37 37 37 33:
• Reflection tracking ±0.05 ±0.03 ±0.03 ±0.03:
• Transmission tracking2 ±0.064 ±0.063 ±0.063 ±0.099:
• Uncertainty plots: power level of -20 dBm, 10 Hz IF bandwidth, no averaging, battery saver off, and 60-:
• minute warm-up time. Includes uncertainties due to drift, noise, compression, and dynamic accuracy.:
• Coverage factor of 1 applied to uncertainties, for ease of comparison with other industry handheld:
• analyzers.:
• Transmission uncertainty (S21, S12):
• Reflection uncertainty (S11, S22):
• 1. When applied power exceeds -5 dBm, calibration results will be degraded from the performance indicated in this table.:
• 2. Load match and transmission tracking are typical values.:
• N9912/13/14/15C, N4690D ECal Option 003, Full 2-port Cal, DUT: Type-N, Spec:
• Corrected performance table calculated using uncertainties with a coverage factor of 2.:
• Corrected performance:
• (dB) 1 0.3 to 2 MHz 2 to 10 MHz 10 to 500:
• MHz 0.5 to 2 GHz 2 to 8 GHz 8 to 10 GHz:
• Directivity 30 40 45 45 40 40:
• Source match 28 35 40 43 40 40:
• Load match2 28 35 40 37 37 33:
• Reflection tracking ±0.12 ±0.07 ±0.05 ±0.03 ±0.03 ±0.03:
• Transmission tracking2 ±0.12 ±0.07 ±0.05 ±0.063 ±0.063 ±0.098:
• Uncertainty plots: power level of -20 dBm, 10 Hz IF bandwidth, no averaging, battery saver off, and 60-:
• minute warm-up time. Includes uncertainties due to drift, noise, compression, and dynamic accuracy.:
• Coverage factor of 1 applied to uncertainties, for ease of comparison with other industry handheld:
• analyzers.:
• Transmission uncertainty (S21, S12):
• Reflection uncertainty (S11, S22):
• 1. When applied power exceeds -5 dBm, calibration results will be degraded from the performance indicated in this table.:
• 2. Load match and transmission tracking are typical values.:
• TDR Cable Measurements (Option 215):
• The performance listed in TDR cable measurements, VNA time domain, mixed-mode S-parameters and:
• vector voltmeter sections applies to the capabilities available in the following models::
• Description Model number:
• FieldFox RF & microwave (combination) analyzers N9912C, N9913C, N9914C, N9915C:
• See FieldFox Configuration Guide for option information. Many capabilities listed in this Data Sheet:
• require options.:
• The TDR cable option adds time domain reflectometry (TDR) measurements to FieldFox’s CAT mode.:
• FieldFox’s TDR measurements are based on an inverse Fourier transform of the frequency-domain data.:
• TDR measurements are useful in not only identifying the location of faults along cables, but also the:
• nature of the fault. Resistive, inductive and capacitive faults will each have a different response. These:
• differences help engineers and technicians’ trouble-shoot line faults.:
• Measurements: TDR (linear rho), TDR (ohm), TDR & DTF:
• Y-axis: linear (rho) or impedance (ohm):
• X-axis: distance (meters or feet):
• VNA Time Domain (Option 010):
• In time-domain mode, FieldFox computes the inverse Fourier transform of the frequency-domain data to:
• display reflection or transmission coefficients versus time.:
• Setup parameters:
• Time Start, stop, center, span:
• Gating Start, stop, center, span, and on/off:
• Numbers of points, velocity vector, line loss, window shape, independent control for all four traces:
• Time stimulus modes:
• Low-pass step Low-pass step is similar to a traditional time domain reflectometer (TDR):
• stimulus waveform. It is used to measure low-pass devices. The:
• frequency-domain data should extend from DC (extrapolated value) to a:
• higher value.:
• Low-pass impulse Low-pass impulse response is used to measure low-pass devices.:
• Bandpass impulse The bandpass impulse simulates a pulsed RF signal and is used to:
• measure the time domain response of band-limited devices.:
• Windows:
• The windowing function can be used to filter the frequency domain data and thereby reduce overshoot and ringing in:
• the time domain response.:
• Windows Minimum, medium and maximum, manual entry of Kaiser Beta and:
• impulse width.:
• Gating:
• The gating function can be used to selectively remove reflection or transmission time domain responses. In:
• converting back to the frequency domain, the effects of the responses outside the gate are removed. The results can:
• be viewed with gating on and off, using two traces.:
• Gate types Notch, bandpass:
• Gate shapes Maximum, wide, normal, minimum:
• Mixed-Mode S-Parameters (Option 212):
• Mixed-mode S-parameters are also known as balanced measurements. Not available for N9912C.:
• Measurements:
• Scc11 Common mode reflection:
• Sdd11 Differential mode reflection:
• Scd11 Differential mode stimulus, common mode response:
• Sdc11 Common mode stimulus, differential mode response:
• FieldFox’s mixed-mode S-parameter measurements require the use of the default factory calibration or a:
• user 2-port calibration. So, the FieldFox analyzer must be equipped with 2-port measurement functionality:
• to measure mixed-mode S-parameters. Mixed-mode S-parameters are an extension of the VNA:
• capabilities.:
• Vector Voltmeter (VVM) (Option 308):
• With vector voltmeter mode, you can characterize the difference between two measurements easily. The:
• zeroing function allows you to create a reference signal and characterize the difference between two:
• device measurements. The results are shown on a large display in digital format.:
• Model Options Frequency range:
• N9912C NA4 and 308 3 kHz to 4 GHz:
• NA6 and 308 3 kHz to 6.5 GHz:
• NAX and 308 3 kHz to 10 GHz:
• N9913C 308 3 kHz to 4 GHz:
• N9914C 308 3 kHz to 6.5 GHz:
• N9915C 308 3 kHz to 10 GHz:
• Setup parameters:
• 1-port cable trimming Reflection (S11 or S22 measurement), magnitude and phase:
• 2-port transmission Transmission or S21 measurement, magnitude, and phase:
• A/B and B/A Ratio of two receivers or channels, magnitude, and phase – Need an external signal:
• generator for the A/B or B/A measurement:
• Frequency (one CW frequency point):
• IF bandwidth: 10 Hz to 100 kHz or 3 Hz to 30 kHz:
• Output power: Low, high, manual:
• Ratio accuracy (A/B and B/A):
• Must zero before measuring DUT. Recommend using a high-quality power splitter or 6 dB attenuators to:
• minimize uncertainty due to mismatch.:
• Frequency Nominal (dB):
• N991xC 100 kHz to 2 GHz ± 0.2:
• Spectrum Analyzer (Option SAx on N9912C or:
• Option 233 on Combination Analyzers):
• The performance listed in this section applies to the spectrum analyzer capabilities available in the:
• following models::
• Description Model number:
• FieldFox RF combination analyzers N9912C, N9913C, N9914C, N9915C:
• FieldFox RF spectrum analyzers N9933C, N9934C, N9935C:
• See FieldFox Configuration Guide for option information. Many capabilities listed in this Data Sheet:
• require options.:
Frequency and time Specifications
• Model Option Frequency range 1:
• N9912C SA4 3 kHz to 4 GHz:
• SA6 3 kHz to 6.5 GHz:
• SAX 3 kHz to 10 GHz:
• N9913C 233 3 kHz to 4 GHz:
• N9914C 233 3 kHz to 6.5 GHz:
• N9915C 233 3 kHz to 10 GHz:
• N9933C 3 kHz to 4 GHz:
• N9934C 3 kHz to 6.5 GHz:
• N9935C 3 kHz to 10 GHz:
• Frequency reference, -10 to 55 °C:
• Accuracy ±0.9 ppm (spec) + aging:
• ±0.5 ppm (typical) + aging:
• Accuracy, when locked to GPS ±0.01 ppm (nominal):
• Accuracy, when GPS antenna is disconnected ±0.4 ppm (nominal) 2:
• Aging rate ±1 ppm/yr for 20 years (spec), will not exceed ±3.5 ppm:
• Frequency readout accuracy (start, stop, center, marker):
• ± (readout frequency x frequency reference accuracy +:
• RBW centering + 0.5 x horizontal resolution):
• Horizontal resolution = frequency span / (trace points – 1):
• RBW centering::
• 5% x RBW, FFT mode (nominal):
• 16% x RBW, step mode (nominal):
• 1 The spectrum analyzer is tunable to 0 Hz or DC.:
• 2 The maximum drift expected in the frequency reference applicable when the ambient temperature changes ± 5°C from the:
• temperature when the GPS signal was last connected.:
• Marker frequency counter:
• Accuracy ± (marker frequency x frequency reference accuracy + counter resolution):
• Resolution 0.1, 1, 10 Hz:
• Frequency span Spec:
• Range 0 Hz (zero span), 10 Hz to maximum frequency range of instrument:
• Resolution 1 Hz:
• Accuracy ± (2 x RBW centering + horizontal resolution) for detector = Normal:
• Sweep time readout Measured value of the time required to complete a sweep from start to finish,:
• including time to tune receiver, acquire data, and process trace.:
• Trace update Nominal:
• Span = 20 MHz, RBW,:
• VBW = 3 kHz:
• 9 updates per second:
• Span = 100 MHz, RBW, VBW:
• autocoupled:
• 25 updates per second:
• Span = 10 GHz, RBW = 1 MHz,:
• VBW autocoupled:
• Approximately 2 updates per second:
• Center frequency tune and transfer1 Nominal:
• 101 points, zero span 80 ms:
• 101 points, 1 MHz span 75 ms:
• 101 points, 100 MHz span 75 ms:
• Sweep time, zero span Nominal:
• Range 1 μs to 6000 s:
• Resolution 100 ns:
• Readout Entered value representing trace horizontal scale range:
• Trigger (for zero span and FFT sweeps):
• Trigger type Free run, external, video, RF burst, periodic:
• Trigger slope Positive edge, negative edge:
• Trigger delay Range: -150 ms to 10 s:
• Resolution: 100 s:
• Auto trigger Forces a periodic acquisition in the absence of a trigger event:
• Range: 0 (off) to 30 s:
• Trigger position (zero span) Controls horizontal position of the pulse edge; use sweep time to zoom into:
• pulse edge:
• Range: 0 to 10, integer steps; 0 is left edge of graticule, 10 is right edge of:
• graticule:
• 1 Within full frequency range of instrument, not band dependent.:
• RF burst trigger Nominal:
• Dynamic range 40 dB:
• Bandwidth 20 MHz:
• Operating frequency range 20 MHz to maximum instrument frequency:
• Sweep (trace) point range:
• All spans 101, 201, 401, 601, 801, 1001 (defaults to 401):
• Arbitrary 2 to 20,001 settable through soft key “# Points” or SCPI:
• Bandwidth accuracy Nominal:
• Zero span 10 Hz to 1 MHz ± 5%:
• 3 MHz ± 10%:
• 5 MHz ± 15%:
• Non-zero span 1 Hz to 100 kHz ± 1%:
• 300 kHz to 1 MHz ± 5%:
• 3 MHz ± 10%:
• 5 MHz ± 15%:
Amplitude accuracy and range Specifications
• Amplitude range Average CW power:
• Measurement range DANL to +20 dBm:
• Input attenuator range 0 to 40 dB, in 5 dB steps:
• Preamplifier Nominal:
• Frequency range Full band (3 kHz to maximum frequency of instrument):
• Gain +20 dB, 3 kHz to 10 GHz:
• Maximum safe input level Average CW power DC:
• Frequency range +25 dBm, 0.3 watts ±40 VDC:
• Resolution bandwidth (RBW) Nominal:
• Range (-3 dB bandwidth):
• Zero span 10 Hz to 5 MHz 1, 3, 10 sequence:
• Non-zero span 1 Hz to 5 MHz (>5MHz)2 1, 1.5, 2, 3, 5, 7.5, 10 sequence < 300 kHz, 300:
• kHz, 1 MHz, 3 MHz, 5 MHz (Other RBWs may:
• be set depending on settings):
• Step keys change RBW in 1, 3, 10 sequence:
• Selectivity (−60 dB / −3 dB) 4:1:
• Video bandwidth (VBW):
• 1 Hz to 5 MHz 1, 1.5, 2, 3, 5, 7.5, 10 sequence:
• Display range:
• Log scale 10 divisions:
• 0.01 to 100 dB/division in 0.01 dB steps:
• Linear scale 10 divisions:
• Scale units dBm, dBmV, dBµV, dBmA, dBµA, W, V, A, dBµV/m, dBµA/m, dBG, dBT:
• 50 MHz absolute amplitude accuracy (dB):
• 10 dB attenuation, input signal -40 to -5 dBm, peak detector, preamplifier off1, 300 Hz RBW, all settings auto-coupled. No warm-up:
• required.:
• Spec (-10 to 55 °C) Typical (-10 to 55 °C):
• N991xC/N993xC ±0.60 ±0.20:
• 1 The spec and typical values, with preamp on, are identical to that with preamp off, but the input signal levels are -40 to - 20 dBm .:
• Total absolute amplitude accuracy (dB) with preamp off:
• 10 dB attenuation, input signal -15 to -5 dBm, peak detector, 300 Hz RBW, all settings auto-coupled, includes frequency response:
• uncertainties. No warm-up required.:
• Frequency Spec (-10 to 55 °C) Typical (-10 to 55 °C):
• N991xC/N993xC:
• with preamplifier off:
• 3 kHz to 100 kHz ±1.00 ±0.20:
• ≥ 100 kHz to 15 MHz ±0.80 ±0.15:
• ≥ 15 MHz to 500 MHz ±0.80 ±0.15:
• ≥ 500 MHz to 4.5 GHz ±1.00 ±0.15:
• ≥ 4.5 GHz to 10 GHz ±1.00 ±0.20:
• Total absolute amplitude accuracy (dB) with preamp on (Option 235 required and turned on):
• 20 dB attenuation, input signal -25 to -15 dBm, peak detector, 300 Hz RBW, all settings auto-coupled, includes frequency response:
• uncertainties. No warm-up required.:
• Frequency Spec (-10 to 55 °C) Typical (-10 to 55 °C):
• N991xC/N993xC:
• with preamplifier on:
• 3 kHz to 100 kHz ±1.20 ±0.25:
• ≥ 100 kHz to 15 MHz ±0.80 ±0.25:
• ≥ 15 MHz to 500 MHz ±0.80 ±0.15:
• ≥ 500 MHz to 4.5 GHz ±1.00 ±0.15:
• ≥ 4.5 GHz to 10 GHz ±1.00 ±0.15:
• Resolution bandwidth switching uncertainty Nominal:
• RBW < 5 MHz 0.0 dB:
• For signals not at center frequency 0.7 dB peak-to-peak:
• RF input VSWR Nominal:
• 1 MHz to 2.7 GHz 1.9 :1:
• > 2.7 GHz to 7.5 GHz 1.8 :1:
• > 7.5 GHz to 10 GHz 1.9 :1:
• Reference level:
• Range -210 to +90 dBm:
• Traces:
• Detectors Normal, positive peak, negative peak, sample, average (RMS):
• States Clear/write, max hold, min hold, average, view, blank:
• Number of averages: 1 to 10,001:
• Number 4: all four can be active simultaneously and in different states:
• Markers:
• Number of markers 6:
• Type Normal, delta, marker table:
• Marker functions Noise, band power, frequency counter:
• Audio beep Volume and tone change with signal strength:
• Marker table Display 6 markers:
• Marker→ Peak, next peak, peak left, peak right, center frequency, reference:
• level, minimum:
• Tune frequency, for AM/FM tune and listen:
• Marker properties Peak criteria: peak excursion, peak threshold:
• Delta reference fixed: Off or On:
• Time zero fixed: Off or On:
Dynamic range Specifications
• Displayed average noise level (DANL) - (dBm):
• Input terminated, RMS detection, log averaging, 0 dB input attenuation, reference level of -20 dBm, normalized to 1 Hz RBW,:
• measured at non-zero frequency span:
• Preamp Off Preamp On:
• Spec:
• (-10 to 55 °C):
• Typical:
• (-10 to 55 °C):
• Spec:
• (-10 to 55 °C):
• Typical:
• (-10 to 55 °C):
• 3 kHz to 100 kHz -121 -134 -142 -156:
• ≥ 100 kHz to 1 MHz -121 -134 -148 -157:
• ≥ 1 MHz to 15 MHz -134 -141 -157 -162:
• ≥ 15 MHz to 2.6 GHz -139 -148 -158 -165:
• ≥ 2.6 GHz to 4.5 GHz -140 -147 -157 -163:
• ≥ 4.5 GHz to 7.5 GHz -138 -145 -156 -162:
• ≥ 7.5 GHz to 10 GHz -134 -143 -152 -160:
• Residual responses (dBm) Nominal:
• Input terminated preamp off, 0 dB attenuation:
• 9 kHz to 10 MHz -93:
• ≥ 10 MHz to 10 GHz1 -105:
• Input related responses (dBc) Nominal:
• -30 dBm signal at mixer input (excludes frequencies listed below) -85:
• Tuned frequency (f) Excitation frequency Spur frequency Nominal:
• f < 2.6 GHz, f ≥ 7.5 GHz to 10 GHz f + 2 *3.56625GHz,:
• f + 3.56625GHz/2:
• f -80:
• f ≥ 2.6 GHz to 7.5 GHz f + 2* 9.3375GHz,:
• f + 9.3375GHz/2:
• f -80:
• fOffset = frequency offset of excitation frequency from tuned frequency (f):
• f < 2.6 GHz, f ≥ 7.5 GHz to 10 GHz f + fOffset f - n * fOffset, (n=1,2, 3,…) -75:
• f + fOffset f - 2 * (5.625MHz ± fOffset) -70:
• f ≥ 2.6 GHz to 7.5 GHz f + fOffset f - n * fOffset, (n=1, 2, 3,…) -75:
• f + fOffset f - 2 * (5.625MHz ± fOffset) -70:
• Other spurious responses (dBc) Nominal:
• LO related spurs:
• 3 kHz to 10 GHz -75:
• Sideband -80:
• Battery charging sideband -70:
• 1 Excludes 3.3114375 GHz at -98 dBm.:
• 1 dB gain compression point (P1dB) 1 - (dBm) Nominal:
• N991xC, N993xC 10 MHz to 100 MHz 0:
• ≥ 100 MHz to 500 MHz +2:
• ≥ 500 MHz to 8 GHz +4:
• ≥ 8 GHz to 10 GHz +7.5:
• Second harmonic distortion Nominal:
• -30 dBm signal at mixer input SHI (dBm) Distortion (dBc):
• N991xC, N993xC 10 to 50 MHz +45 -75:
• ≥ 50 MHz to 1.3 GHz +50 -80:
• ≥ 1.3 to 3.75 GHz +30 -60:
• ≥ 3.75 to 5 GHz +50 -80:
• Third order intermodulation distortion (TOI) Typical (dBm):
• Two -15 dBm signals, 100 kHz spacing at mixer input (-10 to 55 °C):
• N991xC, N993xC 50 MHz to 500 MHz +6.5:
• (+8 @ room temperature):
• ≥ 500 MHz to 2.6 GHz +10:
• ≥ 2.6 GHz to 7.5 GHz +8.5:
• ≥ 7.5 GHz to 10 GHz +10.5:
• Spur free dynamic range (dB) at 2.4 GHz 2/3 (TOI – DANL) Nominal:
• N991xC, N993xC >104:
• 1 Tested with two -tone signals: the first tone signal at –30 dBm mixer input and the second tone with 40 MHz spacing from the:
• first tone at mixer input. Step up the power of the second tone until 1 dB compression has been achieved. 0 dB attenuation,:
• span of 5 kHz, and 30 Hz RBW.:
• Distortion and noise limited (10 Hz RBW) dynamic range:
• (nominal):
• SSB phase noise at 1 GHz center frequency:
• Phase noise (dBc/Hz):
• SSB phase noise at 1 GHz:
• Offset Spec (-10 to 55 °C) Typical (-10 to 55 °C):
• 10 kHz -107 -112:
• 30 kHz -109 -113:
• 100 kHz -105 -110:
• 1 MHz -119 -124:
• 3 MHz1 -123 -129:
• 5 MHz -124 -129:
• Phase noise at different center frequencies (nominal):
• 1 Tested at 2.99 MHz.:
• Dynamic range versus offset frequency versus RBW:
• (nominal)1:
• 1 For 1 MHz RBW, the sideband observed may degrade the dynamic range to -68 dBc:
• Baseband mode:
• The performance listed in this section applies to the signal path of “Baseband” for the spectrum/signal:
• analyzer. Switch to the “Baseband” mode to optimize the analyzer’s performance if the input signal is:
• below 6.5 MHz. Preamp is not applicable to the baseband signal path.:
资源下载
以上规格取自是德科技(KEYSIGHT)N9933C 官方英文数据手册;产品定位与功能描述取自是德科技官网该产品页。
是德科技|KEYSIGHT · onetest 仪器资源库


 客服
客服










 粤公网安备44030902003758